


SPX Uptrend Extension May be Underway
Stock-Markets / Stock Market 2017 Jan 28, 2017 - 07:12 PM GMTBy: Tony_Caldaro

 The market started this record week at SPX 2271. After a pullback to SPX 2257 on Monday the market rallied to all-time highs at SPX 2301 by Thursday morning. Then a pullback ended the week at SPX 2295. For the week the SPX/DOW gained 1.15%, and the NDX/NAZ gained 2.0%. On the economic front reports came in even. On the downtick: existing/new home sales, durable goods orders, Q4 GDP, plus weekly jobless claims rose. On the uptick: the FHFA, leading indicators, consumer sentiment, the WLEI, and the final Q4 GDP estimate. Next week is quite a busy one on the economic front, highlighted by the FOMC meeting, monthly payrolls and the PCE. Best to your weekend and week!
LONG TERM: uptrend
Despite the short term uncertainty, at times, the long-term trend continues to exert itself on the major US indices. The SPX/DOW/NDX/NAZ/TRAN/NYSE all made all-time highs this week. For the four major indices this suggests a potential extension of the November uptrend, from SPX 2084, is underway. If so, this uptrend will have done something the previous two impulsive uptrends were not able to do. Extend beyond 2-months in duration.
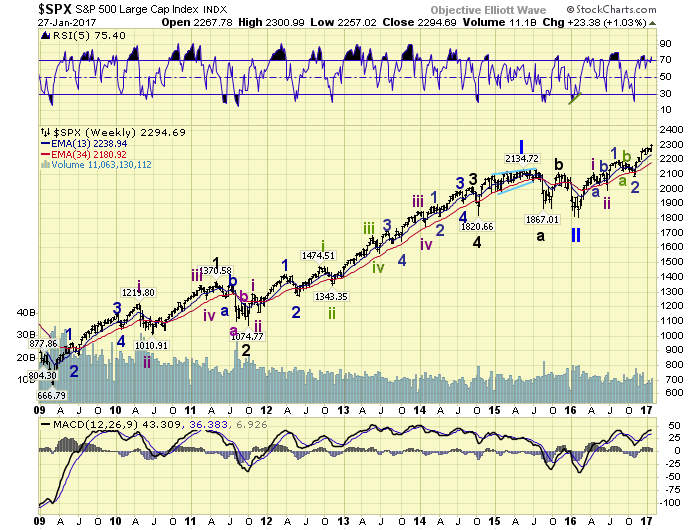
The long-term count from the Primary wave II low in February 2016 at SPX 1810 remains unchanged. Intermediate waves i and ii completed in June. Minor waves 1 and 2, of Intermediate iii, completed in November. And a Minor wave 3 uptrend has been underway since then. Should the SPX clear resistance at 2305, then this uptrend will likely extend into February and beyond. Once SPX 2336 is exceeded, all potential bearish counts will have been technically eliminated. Then SPX 3000+ will be the target over the next 1-3 years.
MEDIUM TERM: uptrend
Every bull/bear market has its own characteristics. Identifying these characteristics early on helps one ride the medium-term trends with more conviction. Markets can be fickle at times, and do things that they have not done in recent months. But the initial characteristics generally hold up throughout the bull/bear trend.
From the November SPX 2084 low we had counted five waves up to SPX 2278 using one set of characteristics, and SPX 2282 using another. In between those two highs there was a pullback to SPX 2234. This is easier to see on the hourly chart below. After the second high the four major indices started to diverge. The SPX entered a 2254-2282 trading range, the NDX/NAZ continued to eke out higher highs, and the DOW hit its lowest level since early-December. Since the DOW had been the leader during this uptrend it suggested to us a downtrend was underway. And the market was just waiting on the NDX/NAZ to head lower. That didn’t happen. After the DOW made the lower low the market drifted up a bit into Monday of this week, and then the market took off to new highs.
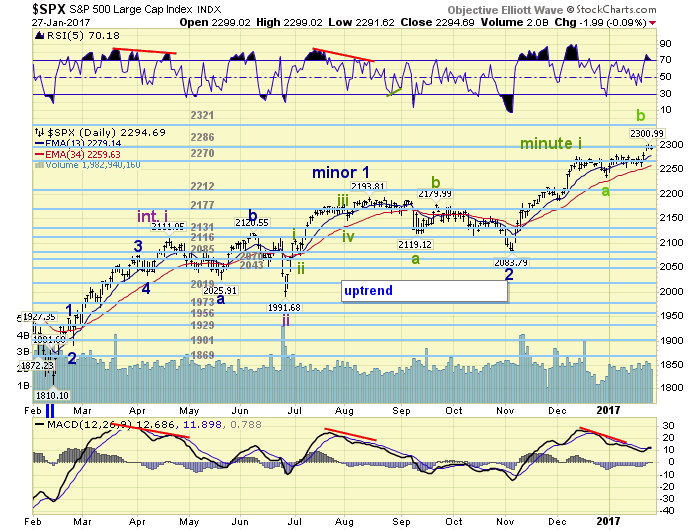
This market action suggested one of two possible scenarios. First, the small B wave we had labeled at SPX 2282 was continuing, noted as a possibility last weekend. Second, the entire uptrend was extending with a Minute wave iii underway. To eliminate the B wave scenario the SPX needs to exceed 2305. Which represents a 1.618 relationship to the 2278-2234 decline. As of this weekend this has not occurred and both scenarios are still in play. Medium term support is at the 2286 and 2270 pivots, with resistance at the 2321 and 2336 pivots.
SHORT TERM
After following both 5-wave up counts to SPX 2278 and SPX 2282 for a while, we settled on the SPX 2278 count as being the correct one. We labeled Minute wave i at the high (2278) and, under the first scenario, a Minute ii underway. We also offered the second scenario, a Minute iii underway, on the DOW charts. SPX 2305 is, as they say, the line in the sand. All the short term activity from the SPX 2278 high was quite choppy in the SPX. Even the rally to SPX 2282 from SPX 2234. Until this week. The rally from Monday’s SPX 2257 low to 2301 was quite impulsive. And the pullback thus far, after 2-days, is only 9 points.
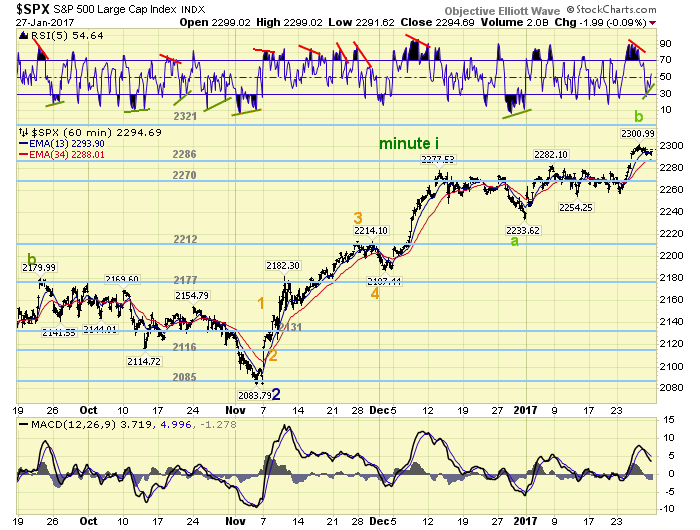
While we may be leaning towards the second scenario, the count posted on the DOW charts, we are waiting for a Fibonacci all clear before starting to look much higher. Minute wave i was 194-points (2084-2278), suggesting Minute wave iii could be just as impressive. One step at a time. Short term support is at the 2286 and 2270 pivots, with resistance at the 2321 and 2236 pivots. Short term momentum ended the week with a positive divergence. Best to your trading next week!
FOREIGN MARKETS
Asian markets were all higher on the week for a net 1.9% gain.
European markets were mixed and gained 0.4%.
The DJ World index gained 1.2%, and the NYSE gained 0.8%.
COMMODITIES
Bonds still appear to be entering an uptrend but lost 0.2% on the week.
Crude is still in an uptrend but lost 0.1%.
Gold remains in an uptrend but lost 1.4%.
The USD is in a downtrend and lost 0.1% on the week.
NEXT WEEK
Monday: personal income/spending and PCE prices at 8:30, then pending home sales at 10am. Tuesday: Chicago PMI and consumer confidence. Wednesday: the FOMC meeting, the ADP, ISM, construction spending and auto sales. Thursday: weekly jobless claims. Friday: monthly payrolls, factory orders and ISM services.
CHARTS: http://stockcharts.com/public/1269446/tenpp
After about 40 years of investing in the markets one learns that the markets are constantly changing, not only in price, but in what drives the markets. In the 1960s, the Nifty Fifty were the leaders of the stock market. In the 1970s, stock selection using Technical Analysis was important, as the market stayed with a trading range for the entire decade. In the 1980s, the market finally broke out of it doldrums, as the DOW broke through 1100 in 1982, and launched the greatest bull market on record.
Sharing is an important aspect of a life. Over 100 people have joined our group, from all walks of life, covering twenty three countries across the globe. It's been the most fun I have ever had in the market. Sharing uncommon knowledge, with investors. In hope of aiding them in finding their financial independence.
Copyright © 2017 Tony Caldaro - All Rights Reserved Disclaimer: The above is a matter of opinion provided for general information purposes only and is not intended as investment advice. Information and analysis above are derived from sources and utilising methods believed to be reliable, but we cannot accept responsibility for any losses you may incur as a result of this analysis. Individuals should consult with their personal financial advisors.
Tony Caldaro Archive |
© 2005-2022 http://www.MarketOracle.co.uk - The Market Oracle is a FREE Daily Financial Markets Analysis & Forecasting online publication.