


Stock Market Major Inflection Point Coming
Stock-Markets / Stock Market 2017 Jan 31, 2017 - 11:51 AM GMTBy: John_Rubino

 Fund manager John Hussman is always good for dramatic charts. Here’s a recent one:
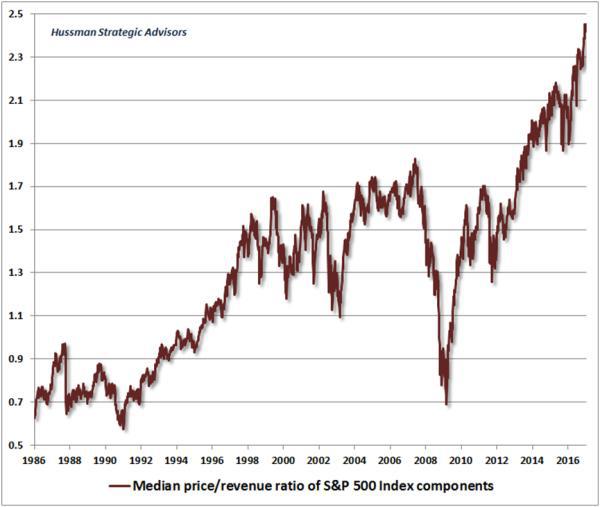
This ratio is even scarier than it looks, says Hussman:
Historically-reliable valuation measures now approach those observed at the 2000 bubble peak. Yet even this comparison overlooks the fact that in 2000, the overvaluation featured a subset of very large-capitalization stocks that were breathtakingly overvalued, while most stocks were more reasonably valued (see Sizing Up the Bubble for details). In many ways, the current speculative episode is worse, because it has extended to virtually all risk-assets. To offer some idea of the precipice the market has reached, this chart shows the median price/revenue ratio of individual S&P 500 component stocks. This median now stands just over 2.45, easily the highest level in history. The longer-term norm for the S&P 500 price/revenue ratio is less than 1.0. Even a retreat to 1.3, which we’ve observed at many points even in recent cycles, would take the stock market to nearly half of present levels.
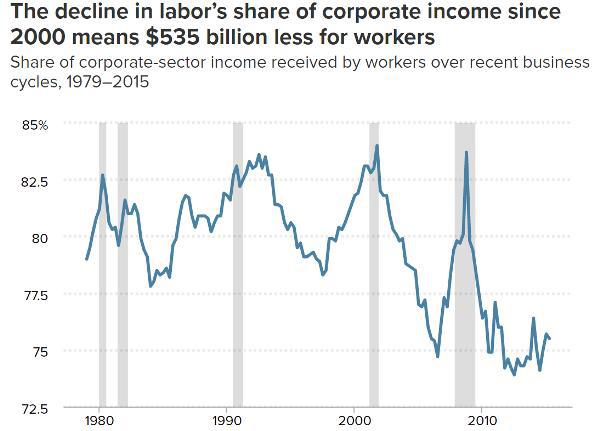
One of the reasons share prices have risen so dramatically relative to revenues is that corporations are earning a lot more on each dollar of sales these days. How are they doing that? By squeezing their workers. The following chart, from the Economic Policy Institute shows labor’s share of corporate income plunging recently.
The next chart illustrates the same point from a different angle. Workers, it seems, have been producing more per hour but their pay hasn’t kept up as their bosses held onto more of the resulting profit.
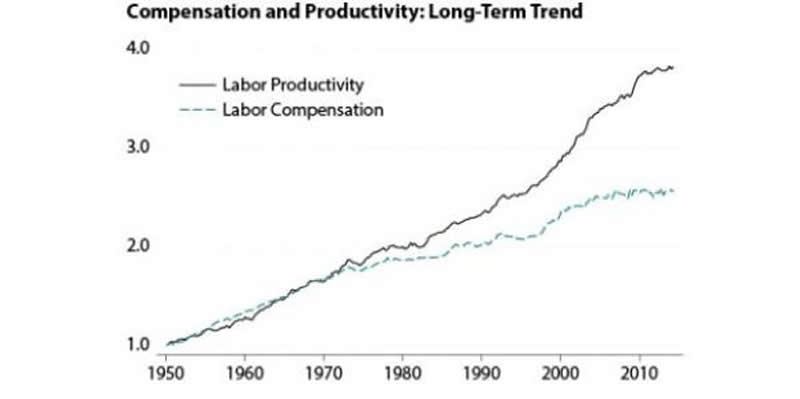
A big part of this has been due to offshoring. If you close a factory where the workers make $30 an hour and set up in a place where your new workers make $5, then the $25 difference flows to the bottom line. Other contributors are automation, which is both inexorable and hugely favorable for the guys who own the robots, and the fact that the minimum wage in many states has kept up with neither the true inflation rate nor the increase in free-trade driven corporate earnings.
As EPI’s Josh Bivens puts it:
This 6.8 percentage-point decline in labor’s share of corporate income might not seem like a lot, but if labor’s share had not fallen, employees in the corporate sector would have $535 billion more in their paychecks today. If this amount was spread over the entire labor force (not just corporate sector employees) this would translate into a $3,770 raise for each worker.
For stock market investors, the scary thing about this imbalance between capital and labor is that it’s only temporary. As the details and magnitude of the scam have been exposed, the political tide has shifted. At the national level, fed-up US workers have installed an anti-free trade administration that is already tilting the playing field towards domestic workers. At the state and local level, calls for a higher minimum wage are being heard and acted upon. A major French party has even nominated a presidential candidate who wants to tax robots.
So it’s safe to assume that the above charts will develop serious inflection points going forward, as a rising share of profits flow to the nether regions of the org chart and investors respond by lowering the value they place on a given dollar of corporate revenues.
As Hussman notes, just a return to 1990s valuation levels would cut the average US stock in half.
By John Rubino
Copyright 2017 © John Rubino - All Rights Reserved
Disclaimer: The above is a matter of opinion provided for general information purposes only and is not intended as investment advice. Information and analysis above are derived from sources and utilising methods believed to be reliable, but we cannot accept responsibility for any losses you may incur as a result of this analysis. Individuals should consult with their personal financial advisors.
© 2005-2022 http://www.MarketOracle.co.uk - The Market Oracle is a FREE Daily Financial Markets Analysis & Forecasting online publication.