


Stock Market Long Cold Winter
Stock-Markets / Stock Market 2017 Feb 01, 2017 - 06:43 AM GMTBy: Ed_Carlson

It appears that equity indices have printed their highs for the post-election rally. However, that doesn't necessarily mean that the correction must begin immediately. Cycles and Lindsay analysis point to a final high closer to February 10. The correction has the potential to be fairly painful as the low is not expected until closer to March 21 and springtime. The Lindsay analysis is as follows:
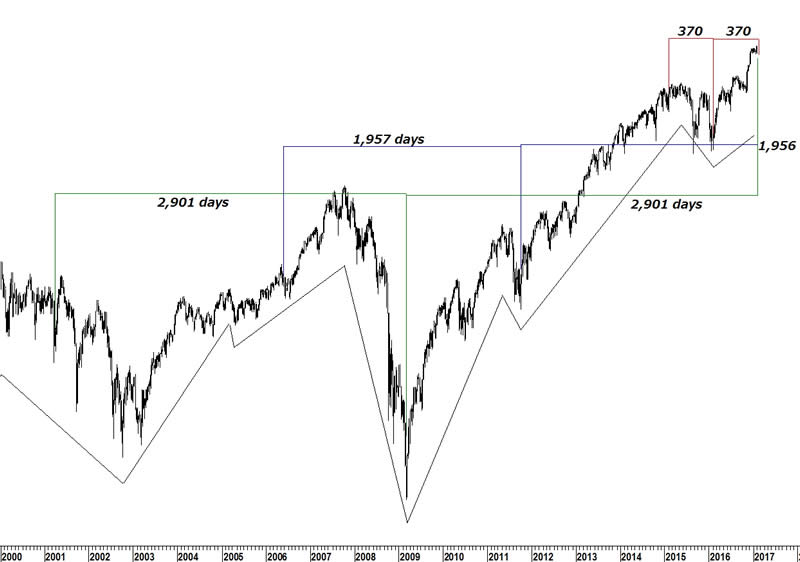
Point E on 3/27/01 of an ascending middle section counts 2,901 days to the low of the multiple cycle on 3/6/09. 2,901 days later is Monday, 2/13/17.
Point E on 5/26/06 of a descending middle section counts 1,957 days to the low of the previous basic cycle on 10/4/11. 1,956 days later is Friday, 2/10/17.
Point E on 2/6/15 of an ascending middle section counts 370 days to the low of the last basic cycle on 2/11/16. 370 days later is 2/15/17.
Lindsay Intervals
A 222-day interval (221-224 days) counts 224 days from the low on 7/1/16 to a change in trend on 2/10/17.
Counting a 107-day interval (102-112 days) from the 11/4/16 low indicates that the top should not arrive prior to 2/14/17.
My single date point forecast for a top is on February 10.
Try a "sneak-peek " this month at Seattle Technical Advisors.com
Ed Carlson, author of George Lindsay and the Art of Technical Analysis, and his new book, George Lindsay's An Aid to Timing is an independent trader, consultant, and Chartered Market Technician (CMT) based in Seattle. Carlson manages the website Seattle Technical Advisors.com, where he publishes daily and weekly commentary. He spent twenty years as a stockbroker and holds an M.B.A. from Wichita State University.
© 2017 Copyright Ed Carlson - All Rights Reserved
Disclaimer: The above is a matter of opinion provided for general information purposes only and is not intended as investment advice. Information and analysis above are derived from sources and utilising methods believed to be reliable, but we cannot accept responsibility for any losses you may incur as a result of this analysis. Individuals should consult with their personal financial advisors.
© 2005-2022 http://www.MarketOracle.co.uk - The Market Oracle is a FREE Daily Financial Markets Analysis & Forecasting online publication.