When the Stock Market Flying Pig Tops
Stock-Markets / Stock Market 2017 Feb 24, 2017 - 05:21 PM GMTBy: Gary_Tanashian
 Flying Pig
Filed under the category ‘smartest group of subscribers in the world’, I got an email from NFTRH subscriber Joe F. last week as I was mechanically managing the gold market in my somewhat downplayed, unexciting way…
“You win 9 out of 10 [I don’t, actually], but I think the setup is there for gold to go immediately.”
For a writer of many words over many years, I can sometimes grunt out the most basic of responses…
“When the pig tops.”
The Pig of course, is the US stock market (and many associated global stock markets as well). Said Pig has slopped, slopped some more and most recently begun actually flying, during its bull phase coming out of last summer’s ‘don’t be short!’ signal at the depths of the Brexit reaction.
The Pig has seemingly got everything going for it; a business-friendly president with forthcoming corporate tax cuts and a heady mix of business deregulation and infrastructure initiatives. But the thing is, the stock market did just a little bulling under the business-unfriendly, regulation-happy previous administration as well.
The yellow shaded area represents a massive recovery and extension courtesy of unprecedented Obama-era monetary policy under the direction of the “Hero”, Ben Bernanke. Trump’s presidency is represented thus far by one little monthly candle, which itself is the product of something that was already in the market according to the NFTRH target, projected last July.
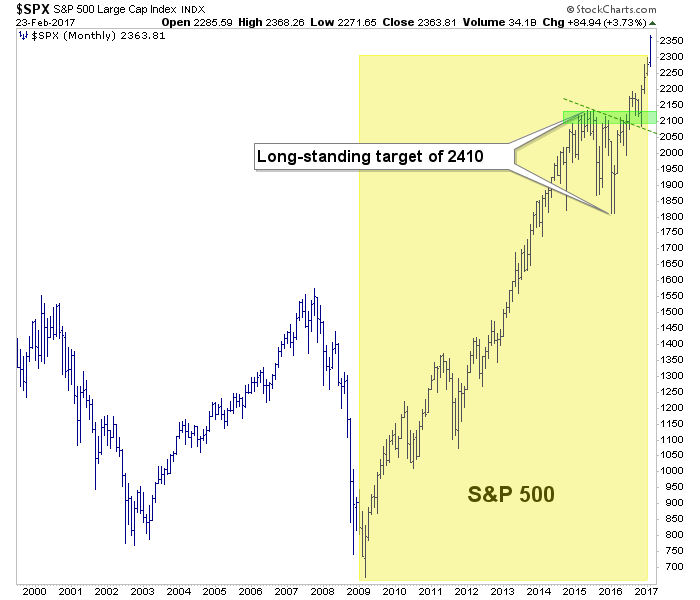
Sure, deregulation is good for stocks, which are after all, equity in corporations. Tax cuts as well. As for the roads, bridges, towers and walls to come… that is fiscal (as opposed to Obama era monetary) stimulus and it could have positive and/or negative effects, depending on the inflation situation at the time these initiatives kick in.
But the main point is that it’s already been baked into the cake. I can say that because I had a target and I am sticking to it. Others can grouse about or cheer the market depending on their bias, but with all the Elliott Waves, Fibonacci levels, momentum indicators and trend lines technical analysts routinely baffle people with, wouldn’t it be funny if it really were as simple as measuring a distance between a high and a low and adding that figure to the high… and then sticking to your discipline over the better part of a year it took for the market to get within spitting distance of said measurement?
In the Mirror: Gold & the Counter-Cyclicals
Early in the precious metals bear market I used to talk about gold being “in the mirror” to the risk on party that was instigated by balls out monetary policy. How could it not be? The party has been all about debt, leverage and momentum. Gold carries no debt, is leveraged to nothing and really just sits there, with everything else in motion around it. That is what insurance does too. It is paid for and tucked away with a level of comfort, but in hopes that you won’t need it.
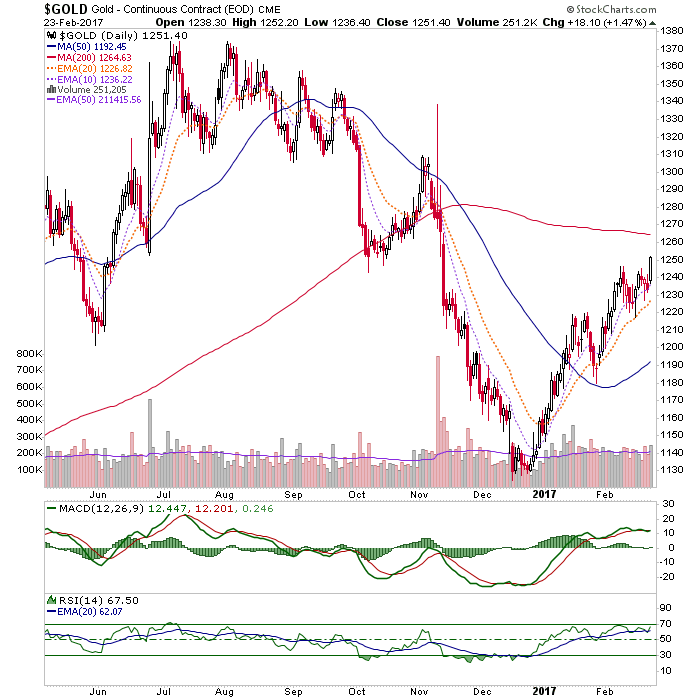
As to its price, it has ticked a new short-term high on its 2017 recovery. There is much work to do, technically, for gold. But that casino patron (price-related) stuff can be left for NFTRH updates or a future public article. The point of this article is that gold is a counter-balance and as a monetary insurance policy it will go where it needs to go when things fall apart (and generally speaking, “when the Pig tops”).
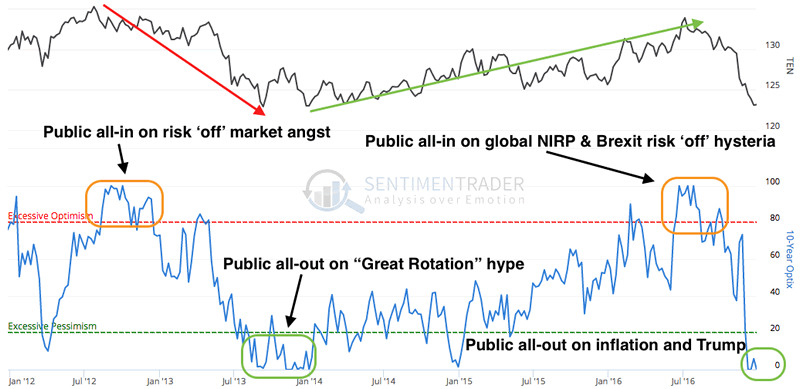
Other counter-cyclicals are simply plays, much like the stock market. Treasury bonds came to be hated by virtually everyone by the end of 2016 (due to the perception of Trumpmania’s coming fiscally stimulated inflation) after being loved by virtually everyone last summer (amid the global NIRP hysteria). So naturally, I took a position against a host of stock market long positions (which I’ve been selling one by one in a very routine profit-taking regimen) as the public became hysterically over bearish of bonds and the Commercial Hedgers became wildly net long.
Here is the Public Optimism graphic (courtesy of Sentimentrader, w/ my markups) from a January 5th post showing the contrary setup for this counter-cyclical tool.
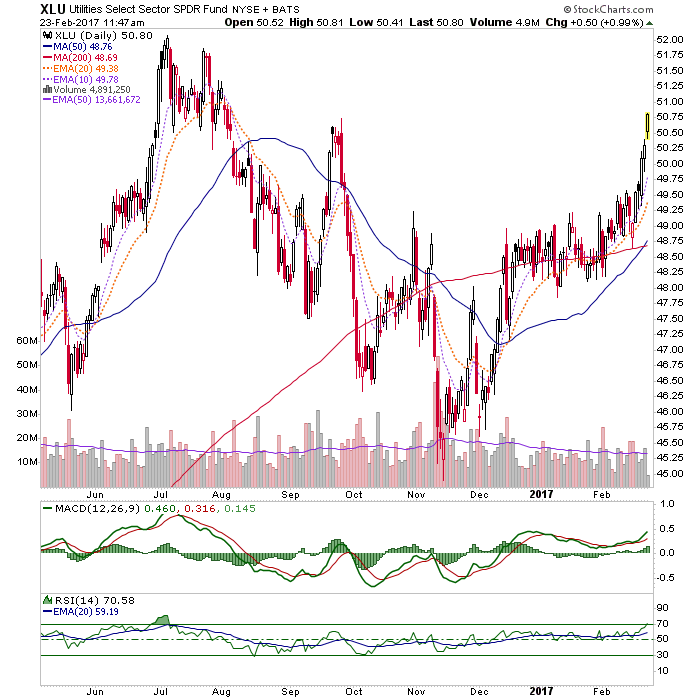
The Utilities and Consumer Staples also offer varying degrees of safety relative to the risk ‘on’ trade in broad stocks. Here’s the daily chart of the Utes SPDR fund, XLU. We have been noting the Utes’ similarity in price performance to long-term Treasury bonds, and I added it to the portfolio a couple of weeks ago based on a) it’s counter-cyclical portfolio balancing nature, b) its dividend payments and c) it’s cool technical pattern (now being expressed upward).
Bottom Line
There is a lot of noise in the market with Trump’s tax cuts and robo tweeting about everything from contentious political issues to the stock market’s status under his stewardship. This is but the most recent and one of the more muted chest thumps…
The stock market seems to be playing Trump and it is playing anyone who believes that things will make sense in a linear fashion like Trump = good for business = good for the stock market. It’s much like what happened to anyone who believed Obama = bad for business = bad for the stock market.
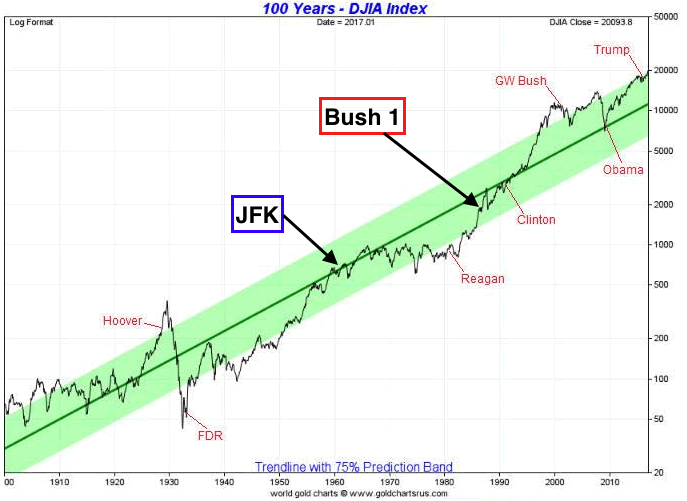
These are the financial markets folks, and they are not linear and they do not present logically in real time. For one example, check out Tom McClellan’s post about crude oil’s 10 year staggered forecast for the US stock market. For another, look no further than the long-term ‘presidential risk’ chart we’ve been pounding lately, most recently in a post that also included some bearish presidential cycle data.
The Bottomest Line
Check your bias and assumptions at the door and have a plan for the counter-cyclical activity that will crop up either sooner or later, either above or below the 2410 target for the S&P 500. Either at our “by March/April” time frame or sometime later. Have balance and perspective (two boring words in a hopped up casino environment, I know).
Subscribe to NFTRH Premium for your 25-35 page weekly report, interim updates (including Key ETF charts) and NFTRH+ chart and trade ideas or the free eLetter for an introduction to our work. Or simply keep up to date with plenty of public content at NFTRH.com and Biiwii.com.
By Gary Tanashian
© 2017 Copyright Gary Tanashian - All Rights Reserved
Disclaimer: The above is a matter of opinion provided for general information purposes only and is not intended as investment advice. Information and analysis above are derived from sources and utilising methods believed to be reliable, but we cannot accept responsibility for any losses you may incur as a result of this analysis. Individuals should consult with their personal financial advisors.
Gary Tanashian Archive |
© 2005-2022 http://www.MarketOracle.co.uk - The Market Oracle is a FREE Daily Financial Markets Analysis & Forecasting online publication.


