The Stocks Relief Rally and Commodities Correction
Stock-Markets / Financial Markets Aug 10, 2008 - 04:15 PM GMT The Wall Street Journal: S&P email – “We should not be rating it”
“Some of the most strongly worded emails from analysts questioning their own ratings came from S&P, according to a draft version of the 38-page report, which includes the firms and was reviewed by The Wall Street Journal. The unit of McGraw-Hill is the largest bond-rating firm by revenue.
“In one email, an S&P analytical staffer emailed another that a mortgage or structured-finance deal was ‘ridiculous' and that ‘we should not be rating it'. The other S&P staffer replied that ‘we rate every deal', adding that ‘it could be structured by cows and we would rate it'.
“Meanwhile, an analytical manager in the collateralized debt obligations group at S&P told a senior analytical manager in a separate email that ‘rating agencies continue to create' an ‘even bigger monster – the CDO market. Let's hope we are all wealthy and retired by the time this house of cards falters. ;O)'”
Source: Aaron Lucchetti, The Wall Street Journal , August 2, 2008.
Bloomberg: Morgan Stanley said to freeze client home-equity credit lines
“Morgan Stanley, the second-biggest US securities firm, told several thousand clients this week that they won't be allowed to withdraw money on their home- equity credit lines, said a person familiar with the situation.
“The action mostly affected clients with properties that have lost value, according to the person, who declined to be identified because the information isn't public. The New York-based investment bank will review home equity lines of credit, or HELOCS, monthly from now on, the person said.
“Wall Street firms including Morgan Stanley are ratcheting back on risks after the collapse of the subprime mortgage market and ensuing credit contraction saddled banks and brokerages with almost $500 billion of writedowns and losses. Consumers fell behind on home-equity credit lines at the fastest pace in two decades in the first quarter, the American Bankers Association reported last month.
“‘Consistent with the terms of the HELOC, or home-equity line of credit, Morgan Stanley periodically reassesses client property values and risk profiles,' said Christine Pollak, a Morgan Stanley spokeswoman in New York. ‘A segment of clients was recently notified of a change in the status of their home equity line of credit or HELOC due to a change in the value of their property and/or their credit profile.'”
Source: Christine Harper, Bloomberg , August 5, 2008.
The New York Times: Housing lenders fear bigger wave of loan defaults
“The first wave of Americans to default on their home mortgages appears to be cresting, but a second, far larger one is quickly building.
“Homeowners with good credit are falling behind on their payments in growing numbers, even as the problems with mortgages made to people with weak, or subprime, credit are showing their first, tentative signs of leveling off after two years of spiraling defaults.
“The percentage of mortgages in arrears in the category of loans one rung above subprime, so-called alternative-A mortgages, quadrupled to 12% in April from a year earlier. Delinquencies among prime loans, which account for most of the $12 trillion market, doubled to 2.7% in that time.
“While it is difficult to draw precise parallels among various segments of the mortgage market, the arc of the crisis in subprime loans suggests that the problems in the broader market may not peak for another year or two, analysts said.”
Source: Vikas Bajaj, The New York Times , August 4, 2008.
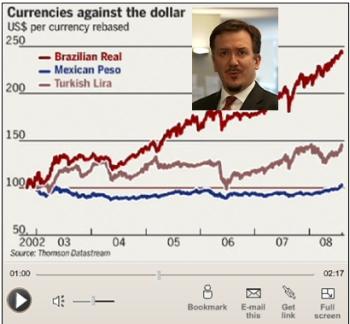
John Authers (Financial Times): Emerging market carry trade – unburst bubble?
Click here for the full article.
Source: John Authers, Financial Times , August 6, 2008.
David Fuller (Fullermoney): Stock markets – give the upside benefit of the doubt
“The obviously beneficiaries of weaker oil and a firmer USD are global stock markets. As the USA has been The Rocky Horror Show in terms of concerns, it is now one of the more obvious candidates for a relief (short covering?) rally. Actually, I maintain that the rally commenced in mid-July, but it has struggled recently due to bad economic news and the proximity of technical resistance from the January-March trading band.
“I think it is now getting a second wind and will recover further, provided that banks hold above their initial support levels established by the higher reaction low on 28th and 29th July. A breach of that level would not confirm a resumption of the bear trend but it would be a warning. The banks' performance today is muted, as they have already had a substantial short covering rally.
“Elsewhere, Wall Street shows the steady performance of Transports, where you can see higher reaction lows since January, and the Nasdaq which never broke beneath its January-March lows. The S&P 500 and Dow have bigger mountains to climb but demand has marginally held the upper hand over supply since the climactic low on 15th July. I will give the upside the benefit of the doubt while the 28th and 29th July lows hold.
“A steady to rising Wall Street would represent a tailwind for other stock markets – remember the influential leash-effect. Most of Europe's indices are quite similar, as can see from the DAX, SMI and FTSE 100. Here also, watch the late-July lows. These indices are a long way from breaking their overall downtrends, I know, but these modest recoveries to date should be extended. Remember, that last down leg from mid-May to mid-July was heavily influenced by oil's spike.
“Asian stock markets should get some traction from a positive Wall Street leash effect and lower oil prices. However, the China leash has yet to turn favourable. India has shown the best form recently. Resources markets are currently among the most subdued, as Brazil and Canada were among the last to peak, but they have some of the best long-term fundamentals, despite the correction underway in commodities. Australia is one of the more oversold markets currently and having seen a downside failure this week, should now at least take out the July rally high.”
Note - charts in this report were prepared before markets in the US, Canada and Brazil had closed.
Source: David Fuller, Fullermoney , August 8, 2008.
Richard Russell (Dow Theory Letters): A big picture Q&A
“The following is what's haunting me. Please follow my line of reasoning. Lowry's studies over many decades show that bear markets end this way. There's a series of 90% (panic) down-days. In due time there is a final 90% down day, and this indicates total seller-exhaustion. This final 90% down day is quickly followed by a 90% up-day. The 90% up-day indicates that big money believes the selling is finally exhausted. The 90% up-day indicates that money, probably institutional money, has come roaring back into the market to load up on what they believe are bargains.
“So far, we've seen only two 90% downside days since the March high. There should be more, how many more nobody knows.
“ Question – Wait, Russell, can't we have a market bottom without any more 90% down-days?
“ Answer – The market can do anything. And with the Transports closing yesterday 1075 points above their January 17 low, I'm still not convinced that this a classic, primary bear market. The stubborn refusal by the Transports to confirm the weaker Industrials keeps me wondering.
“ Question – If, for the sake of argument, we've been in a severe and deceptive correction rather than a true primary bear market, would the 90% down-days and then a 90% up-day have to occur?
“ Answer – Ah, that's the question I've been asking myself all year! I'll repeat – the action of the Transports has me thinking all along that this might not be a true bear market.
“ Question – How do you explain the recent strength in the bonds?
“ Answer – With the dollar turning stronger and today breaking out powerfully from its base, this could bring in foreign buying of US bonds. Up to now with the steadily weakening dollar, foreigners were worried about buying US bonds. But now the “dollar fear” has evaporated. So maybe we're going back to the old formula of stocks and bonds going up together. And with gold and commodities breaking, there's even more incentive to buy bonds.”
Source: Richard Russell, Dow Theory Letters , August 8, 2008.
Barron's: Stocks are cooking on low heat
“Given weak technicals, the durability of the bear-market rally is now in question.
“Investors often ask how we can tell the difference between a bull market and a rally in a bear market. Charting experts will argue many points from choppiness in price action to limited participation in the rally by various sectors of the market.
“I argue that it is all of the above. This confirms that the current rally is of the bear-market variety. And while it can move higher in its current condition, its days are starting to become numbered.
“The phrase ‘fits and starts' is a good one to apply to today's market. Each time traditional technical signals fire off short-term buys, the following few days are spent declining. Joy turns to gloom, and then, when it seems really dark, the market kicks into high gear for a super day or two of gains.
“Followers of Elliott Wave analysis are familiar with the term ‘impulse wave', which is just a strong price move in the direction of the major trend. It is marked by strong momentum and heavy volume as investors act with conviction. Even in a bear market, investors can sell with conviction – heavy volume and urgency to trade – to create downside impulses.
“In contrast, corrections are marked by lower activity and technical indicators that do not confirm the action. For a bear market, the correction is, of course, to the upside. And we should see diminishing volume as the fuel for the rally – bottom-fishers scooping up cheap stocks and short-sellers covering their bets – is used up.
“That is what is happening in the current marketplace.
“Price action since the July low has certainly not been in a strong trend by any definition. A market in a strong bullish trend does not take two steps forward and one step back to allow weak bulls to buy comfortably at what are seen as reasonable prices. Strong markets take five or 10 steps forward, and that can leave the timid in the dust.”
Source: Michael Kahn, Barron's , August 6, 2008.
Bill King (The King Report): Will relief rally last?
“Here's the really big problem for all investors and traders in today's markets: Unless one was operating in 1931, he or she has NEVER experienced what is occurring now.
“As we have noted in past missives, since WWII the Fed instigated recessions when it feared inflation (mostly wages) or excess inventories. The Fed tightened credit and/or increased the cost of credit. When the Fed wanted the recession to end, it cut rates and increased credit. On the fiscal side taxes were cut.
“However, the current situation, recession and the worst financial conditions since The Great Depression, have occurred while the Fed was not only pumping record amounts of credit but was also creating a record number of credit facilities (TAF, TSLF, PBDC).
“Fiscally tax cuts have already been enacted and the deficit is at a record level BEFORE recession has intensified. AND there has been an inordinate amount of socialization and de facto nationalization.
“That's why we asked a couple weeks ago: How do we get out of this mess and get the economy growing given all the fixes, maneuvers and gambits enacted to PREVENT recession and debt contraction?
“The record amount of fixes have rendered the concepts of ‘freely traded markets', ‘moral hazard' and ‘market capitalism' as fantasies. Solons are fighting for the life of the political and financial systems.
“A very astute executive recently informed us that equity prices are extremely important in pricing and garnering credit. You can be sure than solons are keenly aware of this and are acting accordingly.
“Ergo stocks are likely to continue their manic/depressive volatility until an event induces a critical mass of investors and traders to act in a concerted manner.
“The last thing that the Fed should want is for stocks to surge. A large stock market rally will present huge problems later because the Fed, Treasury and solons know that they must administer severe discipline to the markets when they can do so without precipitating an implosion … PS – A big rally could incite inflation and asset bubbles. And the record US budget deficit and dollar must be addressed at some point.
“Ergo stock market returns are likely to be below trend in the coming quarters, if not years. Bill Gross obliquely addressed this issue yesterday on CNBC when he stated that the Fed cannot worry about ‘moral hazard' right now – ‘because in a monsoon you have to provide umbrellas'. Mr. Gross didn't get a chance to elaborate on what this means in the future, so we did.
“Several money managers are calling for the Fed to cut rates now that commodities have declined. Of course these managers are getting killed and cling to a hope that another rate cut or two will matter. It won't. When one ex-Bubblevision commentator turned money manager was challenged that rates have little room to be cut, he retorted, ‘They can cut to zero.' This is so misguided you have to wonder …
“The question for stocks becomes ‘how long will this relief rally (on the latest crisis and ‘fix') last. The post-Bear Stearns crisis relief rally on record Fed credit creation (and vehicles) lasted two months. The ensuing decline on the recessing economy and further bank and GSE woes lasted two months. Will this rally last one or two months? Stay tuned.”
Source: Bill King, The King Report , August 6, 2008.
David Rosenberg (Merrill Lynch): Up-days of 300 points are typical of bear markets
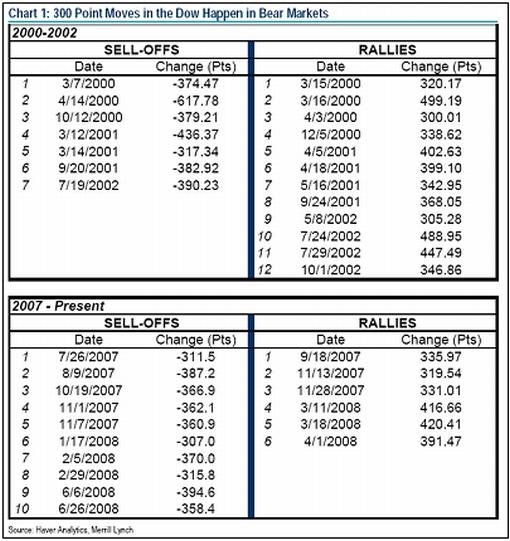
“The Dow surged 331 points – moves like that typically take place in bear markets. There have been six of these sessions since the bear market began a year ago; there were absolutely none in the 2002-07 bull market. Keep in mind that there have been 10 days this down-cycle when the Dow closed down 300 points or more. In other words, volatility gains momentum in bear markets.
“Go back to the 2000-02 bear market and you will see much the same thing – there were actually nearly twice as many 300 up-days in that down-phase as there were 300-point losses! And this was in the context of a 38% peak-to trough decline in the DJIA. So, think of what happened yesterday as a characteristic of a bear market, even if the shorts got painfully squeezed – that should not be lost on investors as we go through this oversold technical rally (that has seen the financials soar 30% from the mid-July lows).”
Source: David Rosenberg, Merrill Lynch , August 6, 2008.
Richard Russell (Dow Theory Letters): Dow is running at a net loss
“Some items to be noted. According to this week's Barron's, earnings on the Dow are now a negative 81.34. The Dow is running at a net loss! This means that the price/earnings ratio for the Dow is infinity. Nothing times nothing = nothing.
“It's happened before. For instance, in July 1932 the earnings on the Dow were negative and the P/E for the Dow went to infinity. The Dow in July 1932 sold to a low of 41.22. The Dow started up in July 1932 and continued to 194 in 1937. That was an advance of 373% beginning from a level at which Dow earnings were actually negative or below zero. Could we be there again?
“I'm not saying that we're in for a repeat of the 1932-37 bull market. I'm just saying that occasionally great buying areas occur during times of seemingly disastrous statistics.”
Source: Richard Russell, Dow Theory Letters , August 4, 2008.
Richard Russell (Dow Theory Letters): Real estate ETF turning up
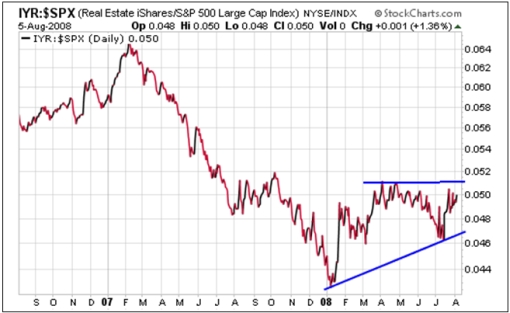
“Here's a chart that every home owner (and Wall Streeters) should like. And it's a chart that I haven't seen anywhere else. What you see here is IYR (the exchange traded fund for real estate shares) relative to the S&P 500 Composite.
“First, note that relative strength for IYR turned up in January. Then a dip with a higher low, and most recently a rally toward the April high. If the current rise in relative strength breaks out above the upper horizontal line, the market will be saying ‘something GOOD' about real estate and housing. It's getting interesting here, even while most analysts continue to moan and groan about real estate and housing!”
Source: Richard Russell, Dow Theory Letters , August 6, 2008.
John Authers (Financial Times): Impact of falling oil on stocks and currencies
“The slick from the sudden fall in oil prices is spreading. Cheaper oil is good for the economy but investors face a risk of accidents as traders retreat from the expectation that the oil price would continue rising.
“The most obvious casualties are energy stocks. Their share prices indicated that the stock market never believed the highest crude prices were sustainable. From crude's brief dip below $50 a barrel in January last year, until its peak last month, it gained 183.5%. Meanwhile, the S&P 500 energy index of US stocks gained only 43.9%, and the MSCI World energy index rose only 29.7%.
“Yet energy stocks have still fallen more than the underlying oil price. Indeed, they are now in a bear market; S&P's energy index is down 20.5% since it peaked in May, almost two months before the top of the crude market. The MSCI index is off almost 19.7%. The crude price is down only 16.3% from its peak.
“With energy stocks one of the most popular vehicles for hedge funds playing the oil boom, they have sold off disproportionately.
“Another casualty: the big oil-exporting emerging markets that were viewed as a geared play on the commodity boom. Both Brazil's and Russia's stock markets peaked at the same time as global energy stocks. Since then, Brazil's Bovespa is down 24.3%, while the dollar-denominated Russian RTS index has shed 27.3%.
“There is one asset class that conspicuously has not yet joined the list of casualties: oil exporters' currencies.
“Brazil's real has appreciated 4.2% against the dollar since energy stocks peaked in May; and by an astonishing 35.6% since oil was last at $50 a barrel. The rouble has also gained slightly since May, and is up 12.8% against the dollar since January last year. How long can this last?”
Source: John Authers, Financial Times , August 5, 2008.
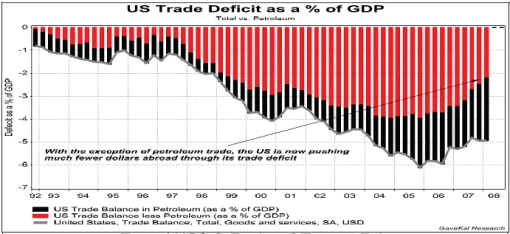
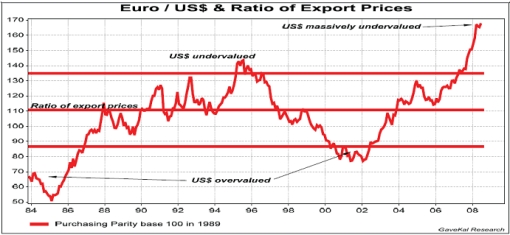
GaveKal: Standing in way of improving dollar is likely to be painful
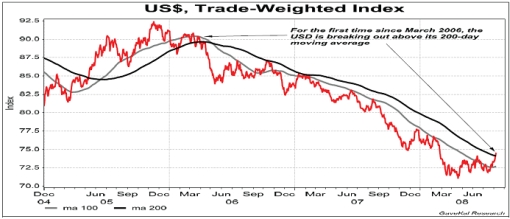
“As more investors realize that the US economy may not be in such dire straits after all, we expect the current positive momentum of the US$ to persist. This is all the more true since the US$ remains very cheap on a purchasing parity basis, especially against the euro, and that the US trade balance is now improving rapidly. Standing in the way of this US$ is likely to be very painful …”
Source: GaveKal – Checking the Boxes , August 8, 2008.
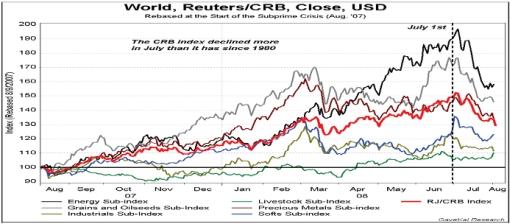
GaveKal: CRB index declining rapidly
Source: GaveKal – Checking the Boxes , August 5, 2008.
David Fuller (Fullermoney): Lengthy correction in commodities
“I am looking for a lengthy medium-term correction, in most commodities … This can be anything from a few months to a couple of years and occasionally more. That assessment is based on historic precedent and any attempt to be more precise would be pure guesswork, since the eventual outcome will depend on a series of events, known and unknown, yet to unfold.
“I think the reactions will often be biggest in tracker fund favourites, since many people have piled into these in recent years. In comparison, it may have little effect on commodities such as iron ore and phosphate, where there are no futures.
“Targets are also guesswork, as you know, and ‘marginal cost of production' is inevitably a ballpark figure that will vary considerably from one region to another. The markets will show us in their own due time. Meanwhile, we can monitor the trends.”
Source: David Fuller, Fullermoney , August 5, 2008.
Business Spectator: China's squeeze on copper
“An important article from Bloomberg reporter Xiao Yu unveils some of the Chinese strategic thinking behind the latest fall in copper and other metal prices. Oil may be affected by similar forces. And the Australian dollar is suffering the twin blows of lower commodity prices and likely lower interests rates. If the dollar keeps falling it will underpin our inflation level, thereby making the September Reserve Bank decision more complex.
“… what we are seeing is a four way squeeze on copper – lower global demand, an interruption in China's power demand, the absorbing of China stockpiles while the price is high and selling by the hedge funds who are being mauled by this process.
“My view is that by using their stockpiles at a time of lower demand, the Chinese appear to be using a fortuitous set of events to put the squeeze on the hedge funds. Last night copper fell again in a trading pattern that indicated hedge fund selling. What Xiao is telling us is that the second half of the year China will be back in the market, by which time they will be hoping that the current squeeze will have lead to lower prices.”
Source: Business Spectator , August 6, 2008.
John Authers (Financial Times): European economy heading for recession
“Europe has moved further along the road towards a recession than the US. The economic data of the past two weeks make that conclusion hard to avoid and Jean-Claude Trichet made no great attempt to deny it in his press conference on Thursday.
“The governor of the European Central Bank admitted that the data ‘point to a weakening of real GDP growth in mid-2008' and said directly that the bank no longer has a bias towards raising rates. He made obligatory commitments to fight inflation but the market drew the necessary conclusions; last month's rate rise from the ECB was a ‘one-off' warning shot and there will be no more.
“This was ample reason to sell the euro, which already looked as though it had peaked after briefly topping $1.60. By the end of European trading, the euro was down 4.4% from its peak against the dollar, back to levels it first set in March.
“Business activity surveys suggest a European contraction in the third quarter. Similar surveys in the US suggest that the American economy, while extremely unhealthy, has not dipped into technical recession.
“Unlike the eurozone, the US has an election this year, and so it has resorted to moves such as the ‘stimulus' tax rebates. This may be why it kept GDP growth positive in the second quarter.
“Ironically, Thursday's US data suggest the worst of the economic hit from housing may be over, but the ‘second-round' effects of the housing and credit busts on the economy are now being felt.”
Source: John Authers, Financial Times , August 7, 2008.
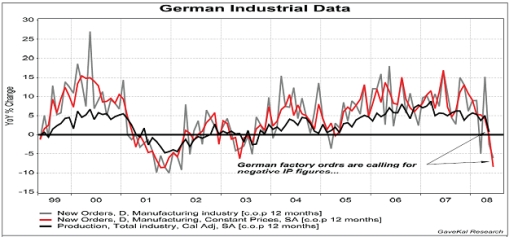
GaveKal: Fears of contraction in German economy
“When Germany announced in May that its GDP had grown an annualized +6% in the first quarter, we were sceptical. We argued that the numbers were deceptively boosted by warm weather – thus boosting construction growth – and the fact that German statisticians have a strong propensity to take numbers at face value. Moreover, we feared that this apparent surge in growth would later be likened to the surge in US growth we witnessed in 3Q07 – which of course preceded a sharp drop in the following quarters …
“While Germany's official 2Q GDP data will not be released until August 14th, our fears seem to have been well grounded. Indeed, a major German newspaper has recently been circulating a ‘leaked” estimate of a -1% contraction for the second quarter, far worse than the expected official release …
“… it increasingly looks like the highly valued euro, the hawkish ECB, the credit crunch, and weaker growth around the rest of the EU and the world … is finally starting to weigh on the German economy. And with EMU retail sales dropping fast, negative industrial production and GDP figures from Germany would remove the primary support left for EU growth outlooks.”
Source: GaveKal – Checking the Boxes , August 7, 2008.
Victoria Marklew: Italian GDP contracted in Q2
“The first of the Eurozone's big economies reported preliminary Q2 GDP data today – and the picture was not a pretty one. Italy's GDP contracted 0.3% q-o-q in Q2, and posted zero growth on the year.
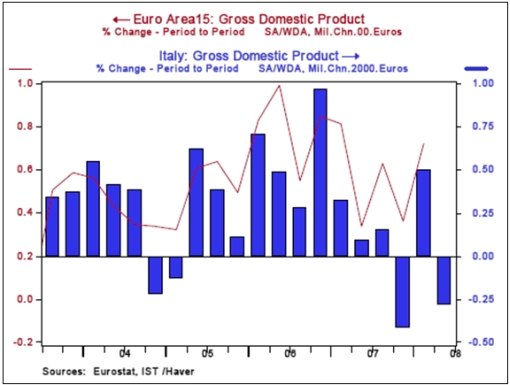
“That Italy's economy is stalling out is no surprise – already one of the weaker economies in the 15-nation Euro-zone, data in recent weeks have pointed to a marked deceleration in the ‘zone's third-largest economy. Consumer morale has plunged to near-15-year lows and business sentiment is the weakest it's been in seven years.”
Source: Victoria Marklew, Northern Trust – Daily Global Commentary , August 8, 2008.
Bloomberg: European producer-price inflation quickens to record 8%
“European producer prices rose the most in at least 18 years in June on soaring energy costs, sharpening the European Central Bank's dilemma over how to balance faster inflation and slowing economic growth.
“The 8% increase from a year ago in factory prices in the 15 nations that use the euro was the biggest since the series began in 1990 and followed a 7.1% gain in May, the European Union statistics office in Luxembourg said today. Economists expected a 7.9% increase, according to the median of 27 forecasts in a Bloomberg News survey.
“The ECB lifted the benchmark interest rate to a seven-year high last month on concerns that consumer-price inflation at twice the 2% limit will become embedded in the economy even as growth slows. ECB President Jean- Claude Trichet said that the central bank ‘will do in the future what is appropriate to deliver price stability'.
“‘Manufacturers throughout the euro zone have been able to pass on higher food and energy costs,' said Philip Shaw, an economist at Investec Securities in London. ‘That's being reflected in consumer prices. While there's no case for a rate cut right now, we're similarly cautious about calls for higher rates because of the damage it would do to the economy.'
“Consumer-price inflation accelerated to 4.1% last month, the fastest pace in more than 16 years, the statistics office reported last week.”
Source: Brian Swint, Bloomberg , August 4, 2008.
BCA Research: BoE – delaying the inevitable
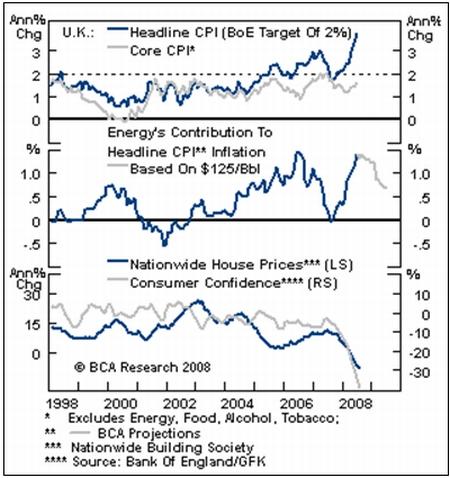
“The Bank of England (BoE) opted to leave the official Bank Rate unchanged at 5%, as expected. However, monetary easing will resume before yearend.
“Policymakers have been hesitant to cut interest rates, given that headline inflation remains well above the central bank's 3% mandated ceiling. However, the meltdown in the UK real estate market is resulting in significant knock-on effects for the domestic economy: consumer sentiment has plunged and spending is beginning to weaken markedly. Indeed, the UK appears to be heading rapidly into recession.
“The BoE's decision to delay monetary relief will only amplify the downturn and inevitably result in the need for more monetary stimulus. Fortunately, the recent setback in crude oil prices should soon feed through into headline inflation, helping alleviate policymaker concerns and providing justification to lower policy rates.
“Bottom line: The BoE will cut aggressively before yearend. Stay short the pound and overweight gilts within a global hedged fixed income portfolio.”
Source: BCA Research , August 8, 2008.
Financial Times: UK house prices tumble
“House prices fell by almost 11% in the year to July, figures showed on Thursday – one of the biggest year-on-year falls recorded in the UK.
“The decline, which means all house price gains since June 2006 have now been wiped out, underscores the speed at which the nation's housing market is deteriorating. The Halifax House Price Index showed prices in July were 10.9% lower compared with the same month last year, and 1.7% below those of the previous month.
“The index's July data are matched by another widely watched index compiled by Nationwide, but the Halifax data mark the first time that homes have posted a single-month double-digit drop, year-on-year, in the history of either index.
“Nationwide's housing index recorded a drop of 10.7% for the three months through December 1990 from the same period in 1989.
“‘This is significant for several reasons,' said Michael Hume, economist at Lehman Brothers. ‘It tells you how out of balance the housing market must have been to generate this level of decline.' The credit crunch has made what should have been a long-term orderly decline in house prices turn into a sudden rout, he said.”
Source: Norma Cohen, Financial Times , August 7, 2008.
David Fuller (Fullermoney): Chinese slowdown mild compared to Western economies
“Inevitably China's GDP growth is slowing following measures introduced early last year to curb economic overheating, and to deflate bubbles in the housing and stock markets. Additionally, most of China's exporters can only experience a downturn because of weak demand from the West.
“I suspect that China's growth will slow more than most analysts are currently forecasting, due more to the factors just mentioned than a post-Olympics drop in Beijing's construction projects. However economic activity anywhere near the Olympic village is already on hold and I assume that there will be a pan-China pause during the games, given their importance to the regime.
“A question for investors: Are these factors behind the slowdown reasons for concern or part of China's success story?
“We have seen China warnings before, and they have been largely wrong. That record will not prevent another wave of bearish articles and reports, now that China's GDP really is slowing, and they will also partly represent a projection of our own economic problems in OECD countries.
“However there is a vital difference between China's slowdown and what we are experiencing in the West. China's economic growth is moderating, largely by government choice, but it is still likely to be a world leader. China has a sound banking system, a massive current account surplus and high personal savings rate.
“Contrast that with the USA, UK and some Continental European economies. Banks are reeling due to reckless speculation and pitiful regulation. Economic growth hovers near recession, both personal and government debt levels are high.
“Taking a long-term view, I know where I would rather invest. China's superior economic prospects will not prevent the stock market from remaining high beta, but it has already fallen a long way. Moreover the Chinese government is now switching its emphasis from curbing economic overheating, and deflating stock market and property bubbles, to boosting economic growth once again. I think they will succeed.”
Source: David Fuller, Fullermoney , August 6, 2008.
Financial Times: Tokyo concedes end to long spell of growth
“The Japanese government conceded on Wednesday that the country's longest postwar period of economic expansion might be over as it reported a drop in its key measure of underlying economic conditions for June.
“The June coincident indicators index fell a preliminary 1.6% and the government downgraded its assessment of the economy to ‘deteriorating'. That marked an admission that the economy had probably entered a recession, with an official declaration possibly to come on Thursday on the publication of the government's June economic report.
“In its assessments in April and May, the government had said only that ‘a change in the phase of the economy may have taken place'.
“Ministers in the new cabinet formed last week by Yasuo Fukuda, the prime minister, have indicated their intention to focus on supporting the economy. They have suggested that the government may drop its goals of achieving a primary budget surplus in the year ending March 2012 and keeping government bond issuance to under Y30,000bn ($274 billion).
“Most economists expect the downturn to be relatively mild.”
Source: Michiyo Nakamoto, Financial Times , August 6, 2008.
Fin 24: India inflation passes record 12%
“Annual inflation in India passed 12%, reaching a thirteen-year high, despite months of increasingly restrictive monetary policy, the nation's Ministry of Finance reported Thursday.
“The wholesale price index – the most-watched inflation benchmark – inched up to 12.01% for the week ending July 26, marginally higher than the 11.98% reported for the previous week.
“This time last year, when global commodities prices were far lower, annual inflation in India stood at just 4.7%, according to the ministry of commerce.
“While the ministry of finance characterised the weekly change as ‘stable' some in India have begun to question whether traditional monetary measures, like raising interest rates and requiring banks to keep more cash on hand, will work for India.
“The Reserve Bank of India has been deploying those measures: Since April, it has hiked its key interest rate – the repo rate, at which it makes short-term loans to commercial banks – by 125 basis points and raised the cash reserve ratio – the amount of cash commercial banks must keep on hand – by 150 basis points.”
Source: Fin 24 , August 7, 2008.
Victoria Marklew: Czech central bank eases as growth slackens
“… the Czech central bank switched to easing mode yesterday, lowering its key repo rate by 25bps to 3.50% – the first actual cut in over four years. Governor Tuma noted that the Czech economy is in a ‘declining phase' and that a ‘bigger dampening' is now expected. The bank also lowered its GDP growth forecasts to 4.1% this year (prev. 4.7%) and 3.6% in 2009 (prev. 4.0%). Tuma also warned that he could not exclude another rate cut this year.”
Source: Victoria Marklew, Northern Trust – Daily Global Commentary , August 8, 2008.
Did you enjoy this post? If so, click here to subscribe to updates to Investment Postcards from Cape Town by e-mail.
By Dr Prieur du Plessis
Dr Prieur du Plessis is an investment professional with 25 years' experience in investment research and portfolio management.
More than 1200 of his articles on investment-related topics have been published in various regular newspaper, journal and Internet columns (including his blog, Investment Postcards from Cape Town : www.investmentpostcards.com ). He has also published a book, Financial Basics: Investment.
Prieur is chairman and principal shareholder of South African-based Plexus Asset Management , which he founded in 1995. The group conducts investment management, investment consulting, private equity and real estate activities in South Africa and other African countries.
Plexus is the South African partner of John Mauldin , Dallas-based author of the popular Thoughts from the Frontline newsletter, and also has an exclusive licensing agreement with California-based Research Affiliates for managing and distributing its enhanced Fundamental Index™ methodology in the Pan-African area.
Prieur is 53 years old and live with his wife, television producer and presenter Isabel Verwey, and two children in Cape Town , South Africa . His leisure activities include long-distance running, traveling, reading and motor-cycling.
Copyright © 2008 by Prieur du Plessis - All rights reserved.
Disclaimer: The above is a matter of opinion and is not intended as investment advice. Information and analysis above are derived from sources and utilizing methods believed reliable, but we cannot accept responsibility for any trading losses you may incur as a result of this analysis. Do your own due diligence.
Prieur du Plessis Archive |
© 2005-2022 http://www.MarketOracle.co.uk - The Market Oracle is a FREE Daily Financial Markets Analysis & Forecasting online publication.


