


Stocks, Bonds, CRB and Gold Multi-Markets Summary
Stock-Markets / Financial Markets 2017 Mar 03, 2017 - 05:25 PM GMTBy: Gary_Tanashian

 Using the most representative or notable index/ETF for each segment, let’s update the general status for a range of items (U.S. and global stocks, T bonds, commodities and gold) with a few informal thoughts.
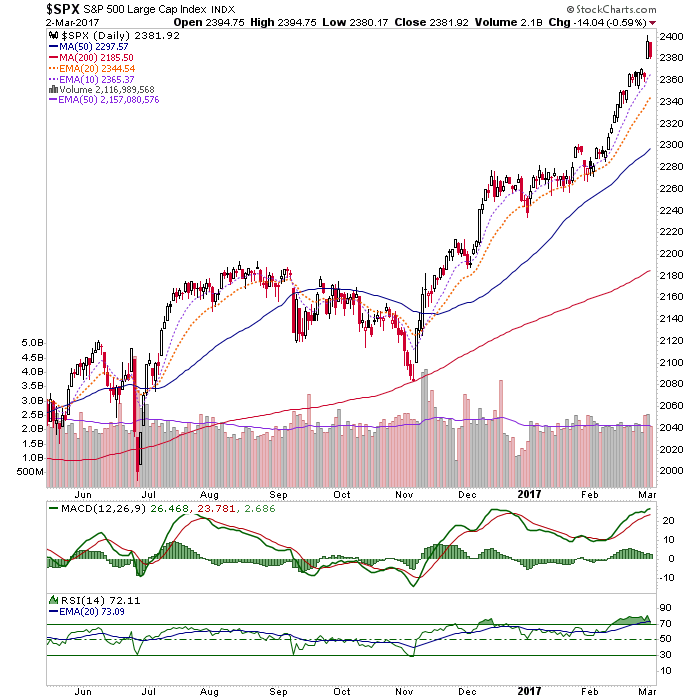
As it’s older brother, the Dow, exceeds our target (21,000), the S&P 500 lurks just below its target of 2410. While the market can (and probably should) correct at any time, the lack of climactic volume (ref. yesterday’s post comparing the current Dow to Silver in 2011) along with over bullish sentiment that continues to resist becoming massively (as in ‘all in’) over bullish imply that such a correction would be a pit stop, not a bear market.
Alternatively, a continued push higher that gains momentum and volume would likely be a gateway to a bear market when it tops out.
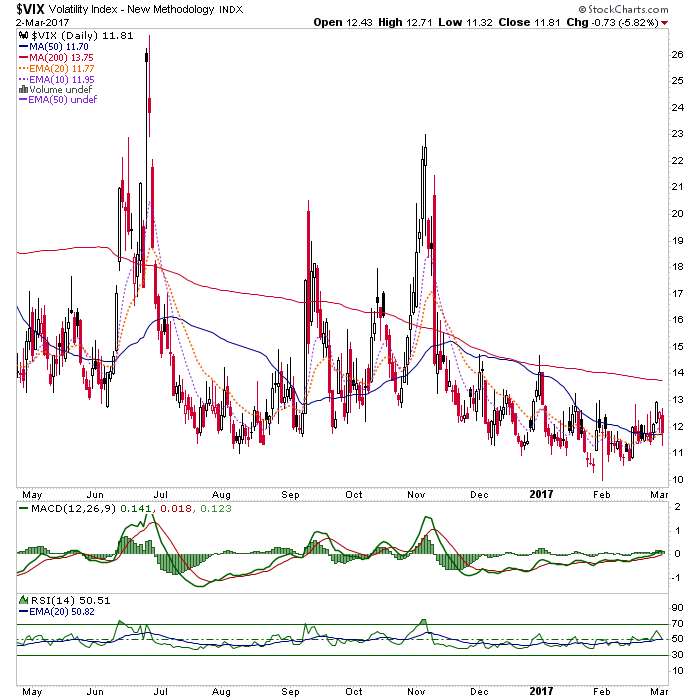
The VIX (volatility index) was conspicuous in its strength 2 days ago when the stock market blasted upward on nothing but future fiscal economic dreams. Yesterday, curiously, it was negative on a down day for the market. Both instances were atypical. Regardless, VIX has been negatively diverging the stock rally for the last month in remaining firm, now at the SMA 50. Buying volatility (or shorting the lack of it) looks like a good hedge right now.
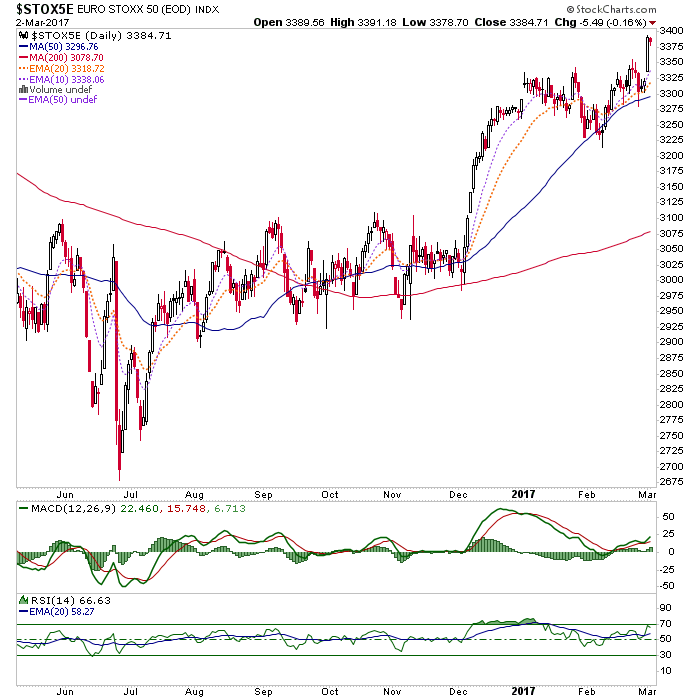
The Euro STOXX 50 is breaking upward from a sweet little daily pattern, which measures to around 3460. Resistance (not shown on the daily chart) comes into play at 3500.
Japan’s Nikkei is breaking upward as the Yen, and its bearish daily chart, break down. No surprise there. I ended my Japan trade quite a while ago as the DXJ ETF came toward target. But a Yen breakdown would increase interest here.

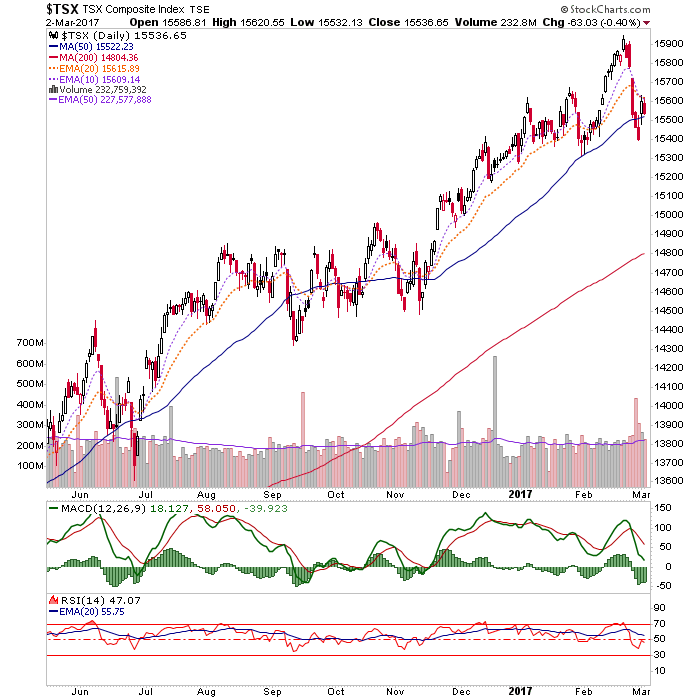
Canada took a hard down but recovered the SMA 50. Not an inspiring chart with RSI below 50. A break above the short-term moving averages would help the situation.
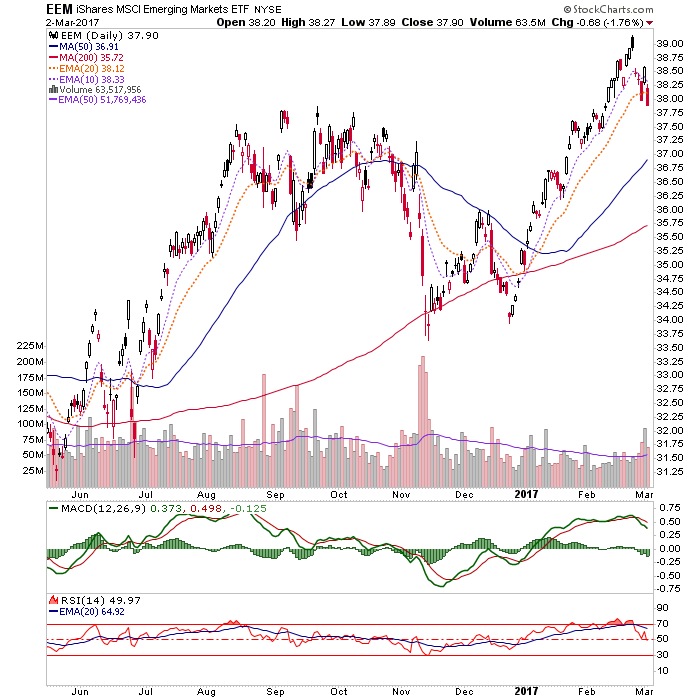
Emerging Markets are looking ugly with RSI red, MACD rolling over and the price below the short-term moving averages. The ‘W’ pattern target was 38, so that is no longer in the mix for an upside objective. A ratio chart we routinely review in NFTRH has shown no reason to favor EMs over U.S. stocks, even when EEM was rising. Now, they are just an ‘avoid’.
Let’s move on to some other items. In the mirror to stocks are the counter-cyclicals and risk ‘off’ contingent. Long-term Treasury bonds have been hammered this week on Fed jawboning and Trumponomic euphoria for the future. I am continuing to nurse a long trade in TLT as a portfolio balancer and income payer. That is only because of the massively bullish contrarian setup (by Commitments of Traders data and public pessimism) and certainly not because of fundamentals. I have not felt the Treasury bond market has had any sort of real fundamentals since policy makers – especially under Bernanke – became so adept at manipulating bonds toward monetary policy goals. But I digress… TLT is not broken yet, but I’ll manage that risk if needed. If on the other hand stocks top out for a correction, this contrary trade would be waiting to welcome hot money flying out of stocks looking for risk ‘off’ liquidity.
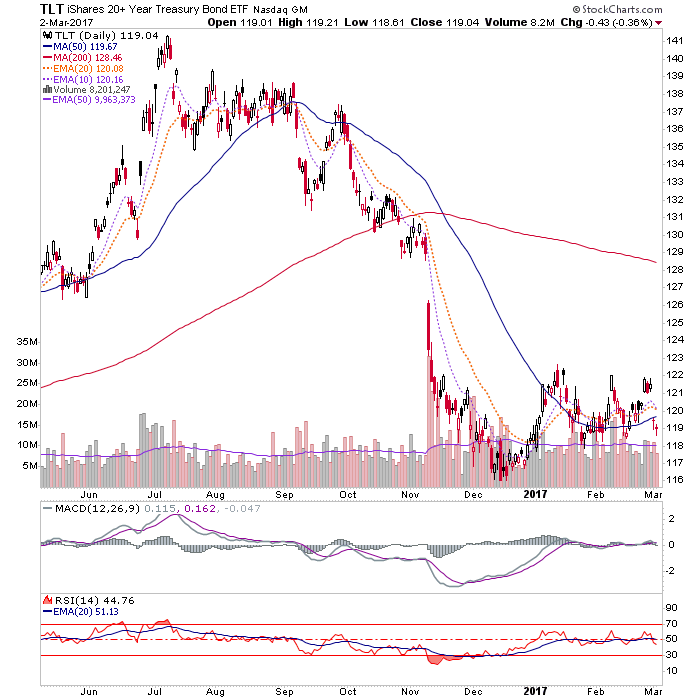
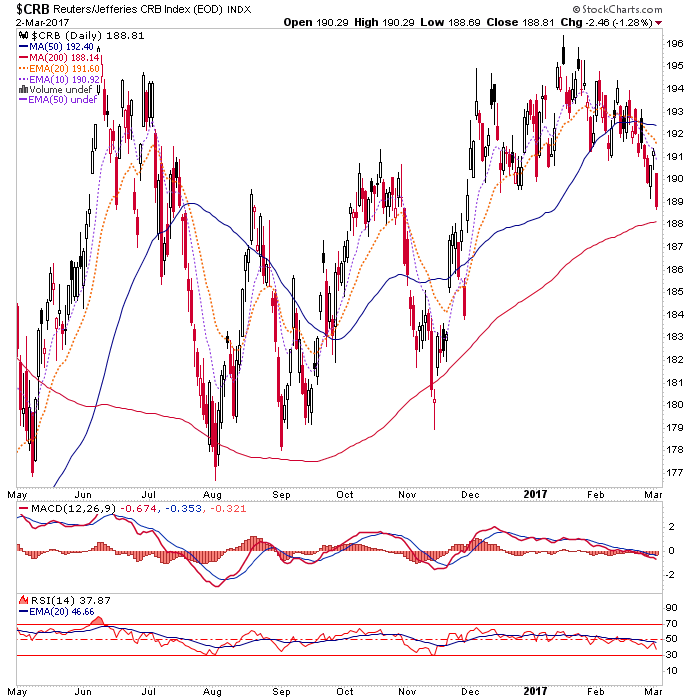
As was questioned in a post yesterday, what is up with both T bonds and Commodities declining lately? Who’s lying to us? They are not going to both go down together. Either inflation is going to really get whipped up and croak T bonds or the opposite, where we’d get a deflationary whiff amid a risk ‘off’ environment that would boost bonds and put commodities down further. I lean to the latter.
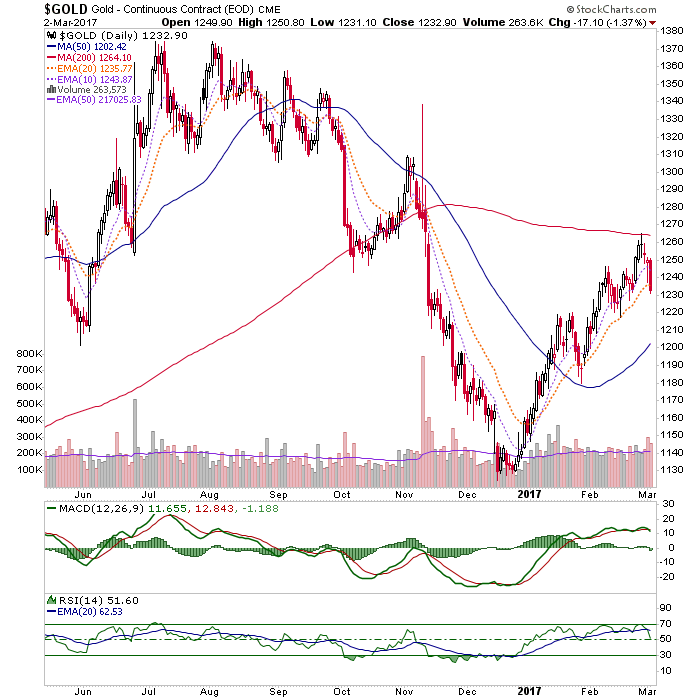
Gold pierced the EMA 20, which has supported it through its 2017 rally. A loss of that level would bring on what I’d see as a buying opportunity at around 1200 and/or the now upturned SMA 50. Gold is in waiting for a counter-cyclical or risk ‘off’ backdrop; period. Forget inflation as a gold fundamental for now. If stocks correct sooner rather than later, I’d expect more near-term upside in gold.
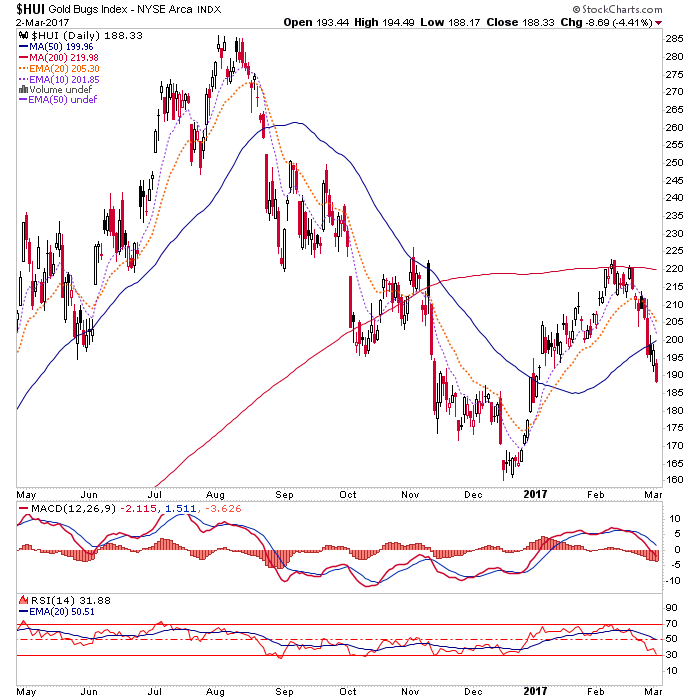
Gold stocks are the same. Give them counter-cyclical or give them… a general ‘avoid’ (with certain speculative exceptions). HUI has dropped below the key support level of 195. It is key because it is also the neckline to a Head & Shoulders pattern that measures to much lower levels. Details are beyond this article’s scope, but suffice it to say the drop below 195 is not good. However, there is short-term lateral support at 180 to 185 and Huey is getting oversold now right into a mining industry trade show (PDAC). So, a bounce is probable before long.
Bottom Line
- Stocks are bullish, overbought and at high risk of correction. They are also not indicated to be preparing for a bear market until epic and climactic volume buys in.
- Treasury bonds and commodities are each under pressure. They will not remain in unison forever. I lean toward a healthy market correction (incl. commodities) and a coming risk ‘off’ cycle, even if a short one. The ultimate play later on would likely be inflation/reflation, a resumed bear phase in T bonds and rally in commodities.
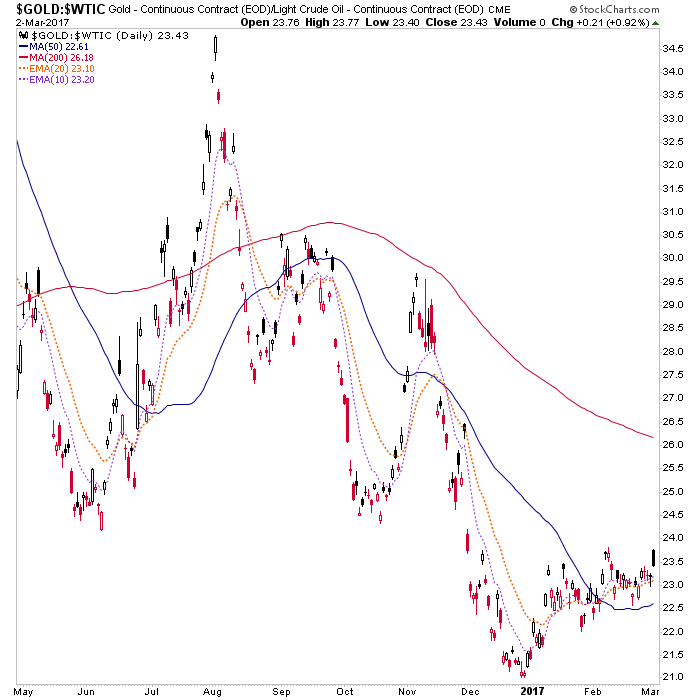
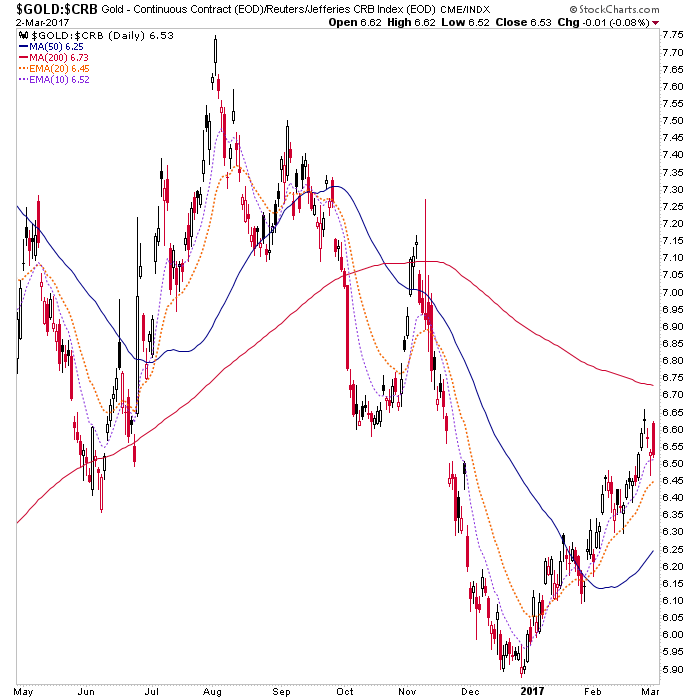
- Gold has been biding time and will be ready for prime time once again only when the stock market blows off for real, and that needs all-in volume. Meanwhile, it could remain firm while in waiting or it could take one of those classic hammer jobs that the sector is so famous for. A lot depends on what is going on around it. That goes double for the more volatile gold mining sector, which will see its bottom line fundamentals improve as gold again outperforms other assets one day. As it stands, gold is looking pretty good vs. mining cost input crude oil and general commodities, despite its nominal weakness of late. That’s a start on the proper macro fundamental environment required for an investment (as opposed to trading) view on the sector.
Subscribe to NFTRH Premium for your 25-35 page weekly report, interim updates (including Key ETF charts) and NFTRH+ chart and trade ideas or the free eLetter for an introduction to our work. Or simply keep up to date with plenty of public content at NFTRH.com and Biiwii.com.
By Gary Tanashian
© 2017 Copyright Gary Tanashian - All Rights Reserved
Disclaimer: The above is a matter of opinion provided for general information purposes only and is not intended as investment advice. Information and analysis above are derived from sources and utilising methods believed to be reliable, but we cannot accept responsibility for any losses you may incur as a result of this analysis. Individuals should consult with their personal financial advisors.
Gary Tanashian Archive |
© 2005-2022 http://www.MarketOracle.co.uk - The Market Oracle is a FREE Daily Financial Markets Analysis & Forecasting online publication.