


Emerging Markets Index ETF (EEM) Increasing Chance of a Correction
Stock-Markets / Emerging Markets Apr 02, 2017 - 05:09 PM GMTBy: MarketsToday

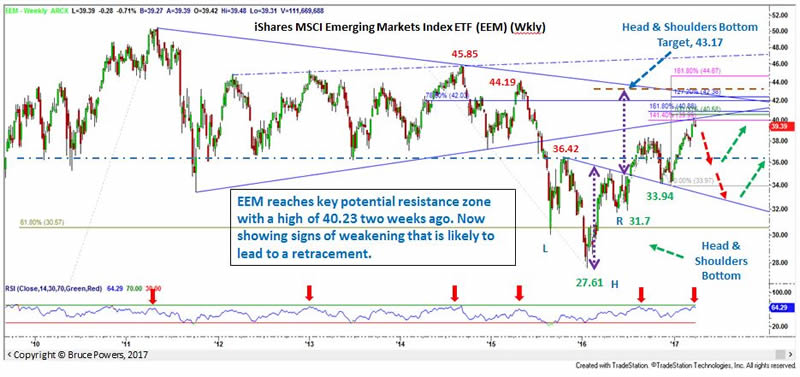
 iShares MSCI Emerging Markets Index ETF (EEM) hit a high of 40.23 two weeks and has since begun to show signs that it may be starting a correction. At that high EEM had advanced 12.62 or 45.71% off the 27.61 bottom reached in January 2016. A move down to at least the uptrend line is looking likely now before this ETF is ready to make another run higher, if it is to do so.
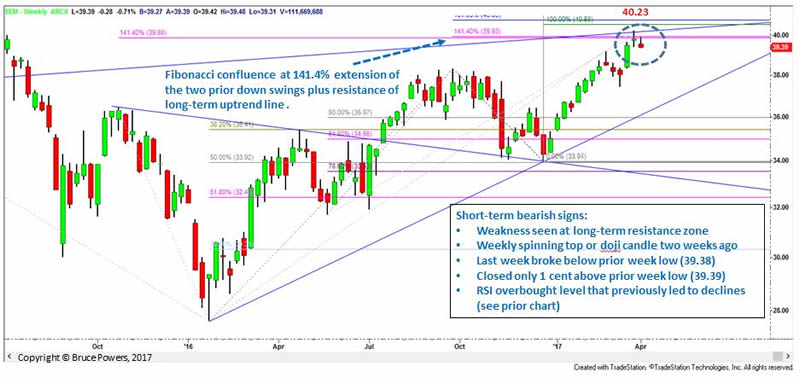
Short-term bearish signs:
- Weakness seen at long-term resistance zone hit two weeks ago.
- Weekly Spinning Top or Doji candle occurred two weeks ago.
- Last week broke below prior week low – although not by much. Prior week low was 39.38 while last week’s low was 39.31.
- EEM closed at 39.39 last week, only 1-cent above prior week’s low.
- RSI at overbought level that previously led to declines (see prior chart).
- 61.8% Fibonacci retracement (38.95) of downtrend off September 2014 peak completed three weeks ago.
Note that EEM broke out of a Head and Shoulders Bottom (HS) reversal pattern in July last year, then pulled back to test the neckline as support in November/December. Price was rejected at the neckline with a Double Bottom and then rallied over the next 13 weeks before hitting resistance at 40.23 two weeks ago. That high has a good chance of holding an advance for now given that it’s at resistance of the long-term uptrend line (bottom ascending line of multi-year Symmetrical Triangle) and at two 141.4% Fibonacci extensions from two recent down swing measurements.
Whether 40.23 is the end to the long-term advance or not remains to be seen. But for now, given the bullish behavior in relationship to the HS breakout and subsequent follow-through, new highs remain a possibility following a retracement. The measuring objective for the HS pattern is above the recent high at 43.17.
A decisive drop below last week’s low of 39.31 gives the next bearish signal with a daily close below that price level confirming weakness.
January’s analysis on EEM can be seen HERE
Bruce Powers, CMT
Chief Technical Analyst
http://www.marketstoday.net/
© 2017 Copyright Bruce Powers- All Rights Reserved
Disclaimer: The above is a matter of opinion provided for general information purposes only and is not intended as investment advice. Information and analysis above are derived from sources and utilising methods believed to be reliable, but we cannot accept responsibility for any losses you may incur as a result of this analysis. Individuals should consult with their personal financial advisors.
© 2005-2022 http://www.MarketOracle.co.uk - The Market Oracle is a FREE Daily Financial Markets Analysis & Forecasting online publication.