


Stock Market Bounce Coming?
Stock-Markets / Stock Market 2017 Apr 17, 2017 - 10:28 AM GMTBy: Andre_Gratian

 Current Position of the Market
SPX Long-term trend: Uptrend continues.
SPX Intermediate trend: The correction from 2400 continues,
Analysis of the short-term trend is done on a daily-basis with the help of hourly charts. It is an important adjunct to the analysis of daily and weekly charts which discuss longer market trends.
Bounce coming?
Market Overview
"Now that enough re-distribution has taken place, we need to extend the decline from the 2375 (s/b 2378) secondary top. This is what my indicators are currently projecting and, if they turn out to be correct, a resumption of the downtrend should start immediately and could extend to a new low before the next consolidaton takes place."
Last week's forecast turned out to be correct! SPX lost 26 points for the week, closing at 2329.13, about 7 points above its correction low of 3/27. The 2329 close represents only part of the count generated by the original distribution pattern, and it may also have completed a subdivision of the total count which could bring about a counter-trend rally. Positive divergence has begun to appear in some of the hourly indicators, with some being very oversold. This would suggest that over the next couple of days, the index could start moving in the opposite direction.
There are some differences with last week in reversal readiness. Then, the indicators had already turned and this made the index more vulnerable to a correction. As of Thursday, the indications of a reversal were not quite as clear and much depends on what happens early next week.
I have marked the 2378 level as the high of the B-wave, but if we we do not break below the former low of 2322 before reversing, it opens the way for a potential mid-point rally slightly beyond the 2378 high for an alternate B-wave high. This is not the preferred scenario. We may be too close to the cycle lows for such a move to take place, but it is possible. A preferred scenario would be to rally 50% of the decline fom 2378. That would place the index at about 2353 before th nest reversal downward occurs.
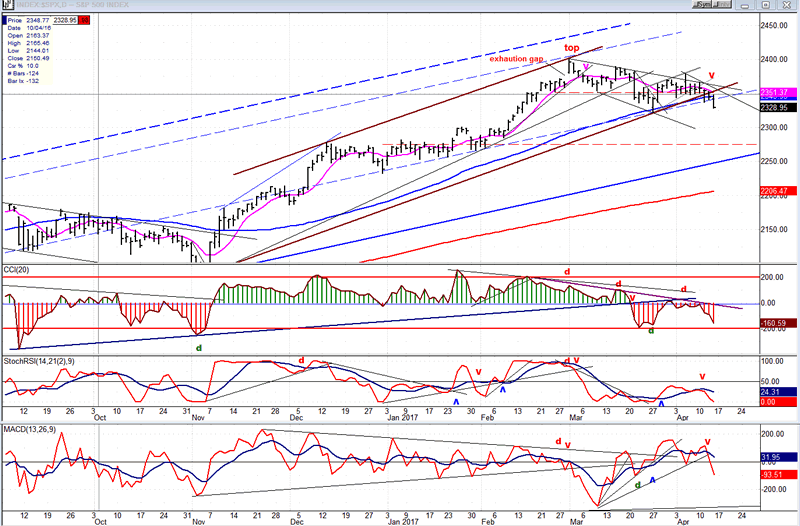
Daily chart
SPX has now broken through the bottom of its channel from 2084 as well as through the 55-day MA -- but not by much, so far -- and it is approaching the former low of the correction. Because some positive divergence is beginning to show at the hourly level, it could hold here before rallying. The fact that this move represents filling a phase count of the distribution top adds to that possibility. If Monday does not materially exceed Friday's low, we could see a counter-trend rally start on Tuesday.
It is normal for trend lines to be re-tested after they are broken, so we should expect at least a back-test to occur. If price moves back inside the channel, the decline may not be quite ready to resume right away, especially if we fail to make a new correction low, and the structure could evolve to produce a stronger rally to an alternate B-wave high, as marked on the hourly chart. However, the odds of putting an end to the correction at this stage are minimal. There are lower counts and the remaining cycle lows are still two to three weeks away.
The daily indicators are not in a positon to warn us that an important reversal is about to take place. All three are still in a downtrend and even if they turned here, the momentum oscillators would do so without producing positive divergence, meaning that it would probably not be a final low.
If the above assumptions are correct, the dashed red line represents good support and would be a good place for the correction to end, especially since in two or three weeks it will intersect with the intermediate blue trend line from 1810.
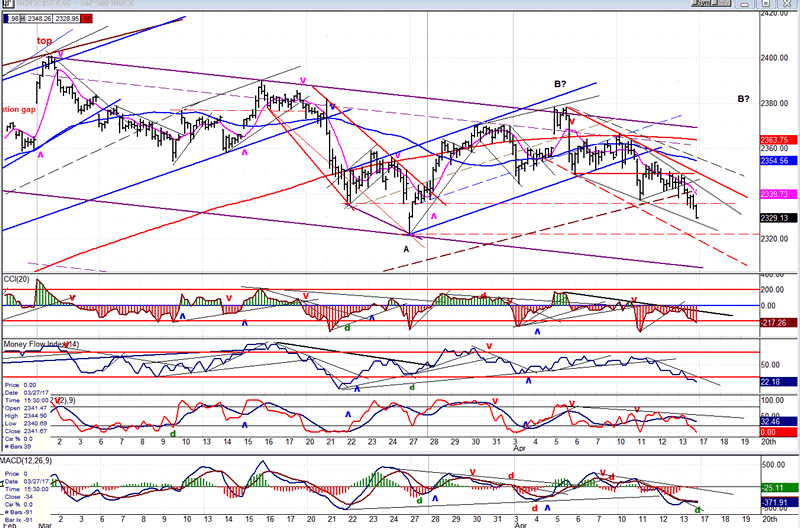
Hourly chart
We are fortunate to have such clear channel structure to help us determine the price direction and reversal points. I mentioned last week that the blue channel formation was built with parallels to the main trend line from 2084. For the next leg down, all we had to do was wait for the lower channel line to be broken. When it was, it caused a sharp down-thrust which continued beyond the bottom channel line of the larger brown channel from 2084, after it provided some minimal support. This should insure that the decline is now becoming one of intermediate nature unless, of course, the index stages a sharp reversal early next week, which develops good upside momentum. In that case, we could be witnessing a change of structure with the B-wave top being moved to the right of its current labeling.
Over the near term, the index is in a declining, red channel which could be turning into a wedge. I have drawn a dashed parallel to the top red channel line, but if the price cannot drop beyond the grey line connecting the previous two minor lows, we are forming a wedge pattern which would make a near-term reversal even more likely.
Only the lower (A/Ds) oscillator is showing divergence, but it is usually the first to do so and a lack of real selling pressure on Monday mornng would cause it to turn up. We also note that the MF and SRSI are oversold. If all the oscillators stabilize on Monday, it could set us up for a "turn-around-Tuesday"!
If we find support in this area, the penetration of the main channel bottom line will have been minimal. Consequently, it is likely that we will do more than a simple back-test of the channel. A 50% retracement from 2378 would take us to 2353, which coincides with the blue (55-hr) MA where resistance could develop. Beyond that, and we are most likely moving the B-wave top to the right, as shown on the chart, in the vicinity of 2080.
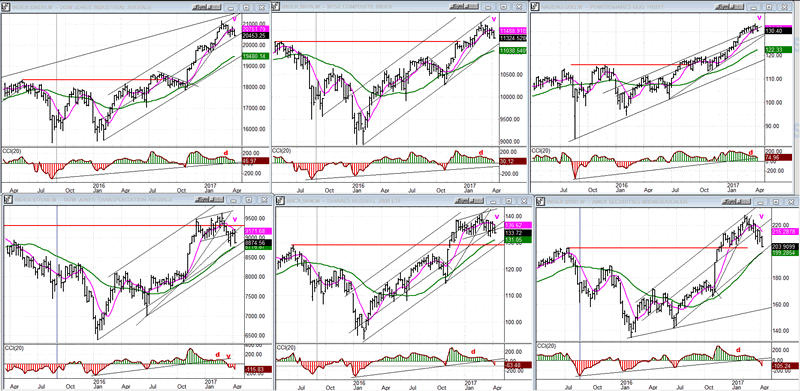
An overview of some important indexes (Weekly charts)
Last week's spell of weakness has brought more casualties to the bottom tier. The oscillators of all three indexes have now issued weekly sell signals. They have also closed below their pink (9-wk) MA and are approaching the green (34-wk) MA.
Those in the top tier have only closed below their pink MA, but have not yet dropped their oscillators into the red. I suspect that they will before this correction is over.
I have already mentioned that TRAN (bottom left) has already retraced below its 2014 top, a sign of long-term weakness. XBD (bottom right) has now retraced to the level of its 2015 top, which denotes long-term deceleration. Also, IWM (bottom center) and NYA (top center) are close to doing the same thing. Only the DJIA (top left) and QQQ (top right) are still well above their respective former tops.
We can now see the value of keeping track of these indexes and comparing the action of these market leaders to the DJIA and SPX (which do not reflect the total market action). If the former continue to weaken significantly relatively to DJIA and SPX, it should alert us to the probability that an important market top is near. This should become flagrant when we make the next high after this correction is over.
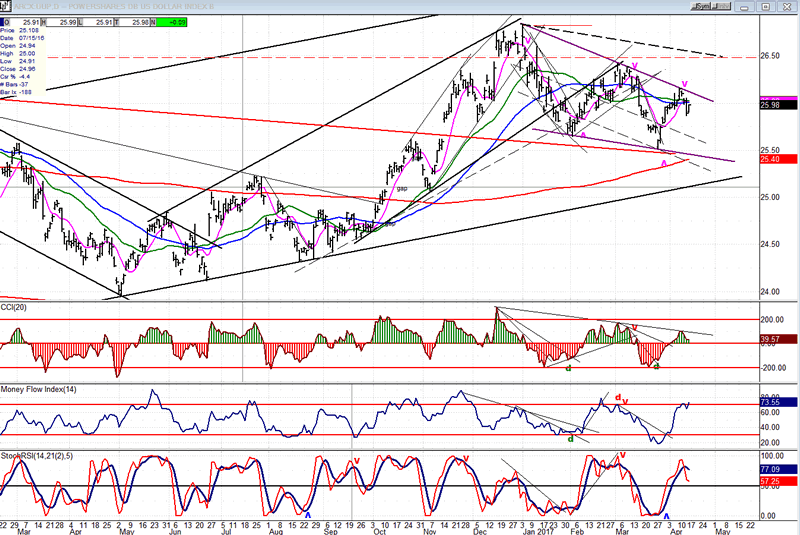
UUP (dollar ETF)
As expected, UUP did find resistance at its downtrend line, with president Trump providing the catalyst by stating that the dollar was too strong. UUP is already rebounding, but it is not clear if it is ready to challenge the trend line again right away, or needs a little more consolidation, first. Until we see evidence to the contrary, UUP is expected to make a new long-term high.
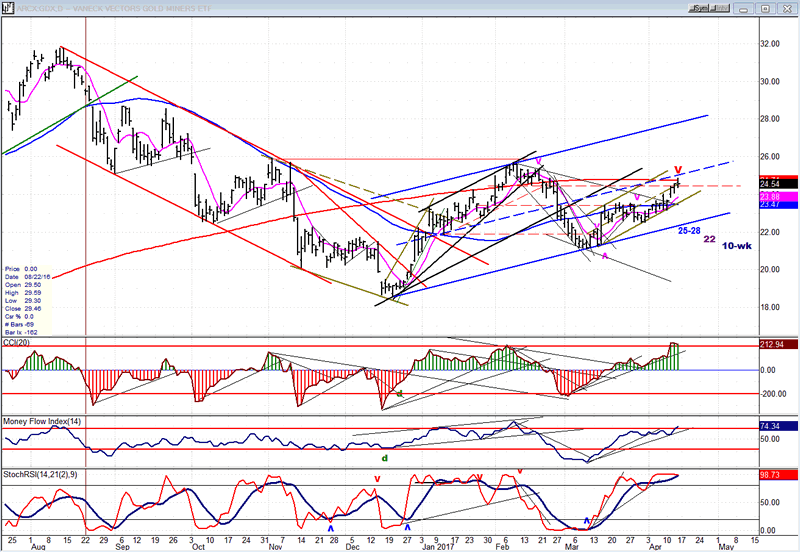
GDX (Gold Miners ETF)
GDX has continued to move up since the 84-wk cycle bottom of early March, but it may have made a temporary high after reaching resistance caused by the mid-channel line and the 200-d MA. In addition, there are cycles bottoming over the next two or three weeks which will have to be heeded before it can resume its uptrend.
Note: GDX is now updated for subscribers throughout the day, along with SPX.
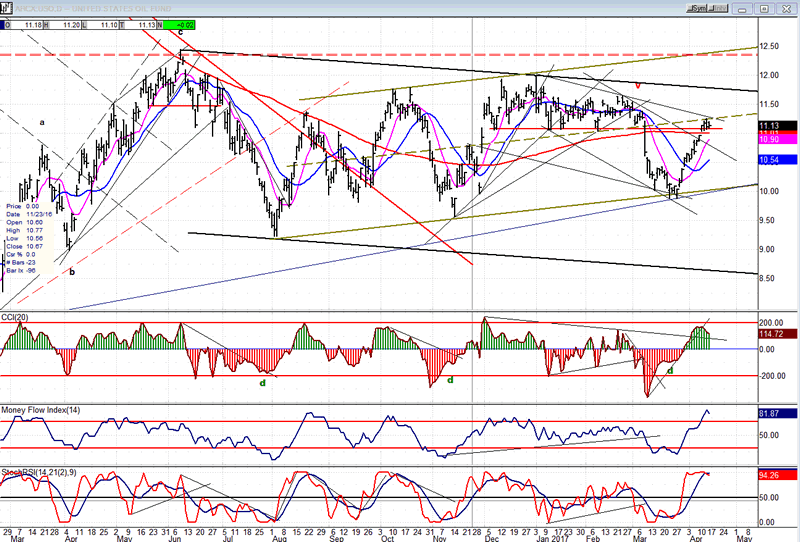
USO (U.S. Oil Fund)
Every time USO has dropped to its lower channel line, it has found ready buyers. In the two previous instances, it continued to rally to the channel top before retracing to the bottom, once again. It could repeat the same action, but this is unlikely since after three consecutive lows, the pattern normally changes. If it finds enough strength to break through the red-dashed line, it could progress to 14.50-15.00, minimum.
Summary:
After adhering to the scenario projected in the last letter, SPX may be ready to reverse course again with a rally in a downtrend which could retrace a minimum of 50% of the decline from 2378 to 2353 before resuming its downtrend. Should it exceed that level with enough momentum, a move to about 2380 would become a possibility.
Andre
FREE TRIAL SUBSCRIPTION
If precision in market timing for all time framesis something that you find important, you should
Consider taking a trial subscription to my service. It is free, and you will have four weeks to evaluate its worth. It embodies many years of research with the eventual goal of understanding as perfectly as possible how the market functions. I believe that I have achieved this goal.
For a FREE 4-week trial, Send an email to: info@marketurningpoints.com
For further subscription options, payment plans, and for important general information, I encourage
you to visit my website at www.marketurningpoints.com. It contains summaries of my background, my
investment and trading strategies, and my unique method of intra-day communication with
subscribers. I have also started an archive of former newsletters so that you can not only evaluate past performance, but also be aware of the increasing accuracy of forecasts.
Disclaimer - The above comments about the financial markets are based purely on what I consider to be sound technical analysis principles uncompromised by fundamental considerations. They represent my own opinion and are not meant to be construed as trading or investment advice, but are offered as an analytical point of view which might be of interest to those who follow stock market cycles and technical analysis.
Andre Gratian Archive |
© 2005-2022 http://www.MarketOracle.co.uk - The Market Oracle is a FREE Daily Financial Markets Analysis & Forecasting online publication.