


Stock Market Lindsay Long Term Intervals
Stock-Markets / Stock Market 2017 Apr 18, 2017 - 10:36 AM GMTBy: Ed_Carlson

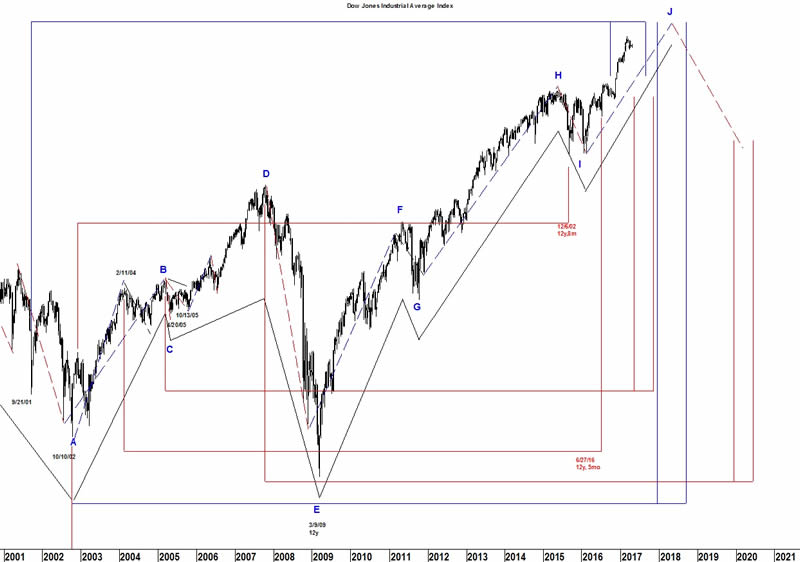
The March 20 Market Update showed our Long Term interval forecast – both 15 and 12 year intervals. As we are now seeing the biggest pullback in the Dow since last autumn we have to assume that the 15yr interval is exerting its influence and the decline won’t end until the 12yr interval (May-November, 2017) takes over.
Lindsay wrote that a 12yr interval counts 12yrs, 2mo. – 12yrs, 8mo. from an important high. However, these long term intervals (as might be expected) were the least exact of all Lindsay’s counts. For example, the 2/11/16 low was exactly 12yrs, 0mo. from the high on 2/11/04. If we account for a possible two month error in the counts, we are already in the 12yr interval time target.
Cycles
Last week’s Market Update noted a 19-day cycle low which points to the next low on April 24 which matches the Hybrid Lindsay forecast for a low on or near April 24-28. Not mentioned was the date of the next 21-day cycle high on April 28. Conclusion: the following rally will be short-lived.
Try a "sneak-peek " this month at Seattle Technical Advisors.com
Ed Carlson, author of George Lindsay and the Art of Technical Analysis, and his new book, George Lindsay's An Aid to Timing is an independent trader, consultant, and Chartered Market Technician (CMT) based in Seattle. Carlson manages the website Seattle Technical Advisors.com, where he publishes daily and weekly commentary. He spent twenty years as a stockbroker and holds an M.B.A. from Wichita State University.
© 2017 Copyright Ed Carlson - All Rights Reserved
Disclaimer: The above is a matter of opinion provided for general information purposes only and is not intended as investment advice. Information and analysis above are derived from sources and utilising methods believed to be reliable, but we cannot accept responsibility for any losses you may incur as a result of this analysis. Individuals should consult with their personal financial advisors.
© 2005-2022 http://www.MarketOracle.co.uk - The Market Oracle is a FREE Daily Financial Markets Analysis & Forecasting online publication.