


Cocoa Commodity Buying Opportunity
Commodities / Cocoa May 01, 2017 - 05:49 AM GMTBy: Austin_Galt

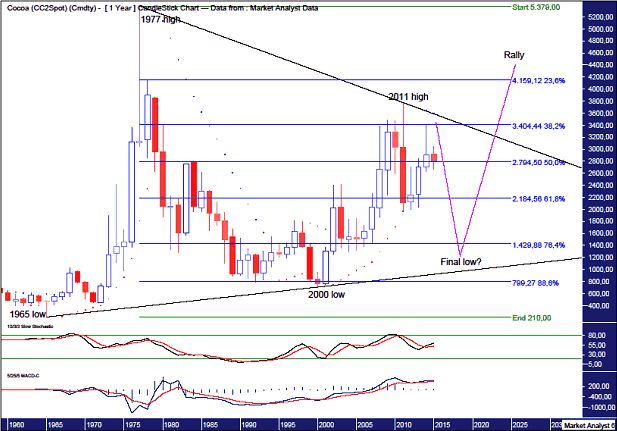
 I last analysed the cocoa price in March 2015 in a report titled Cocoa Technical Outlook. Since then price has traded exactly as outlined. Below is the yearly chart from that analysis.
COCOA Yearly Chart
Now let's update that chart and update the outlook further using the monthly and daily charts because I believe a good buying opportunity is at hand.
COCOA Yearly Chart
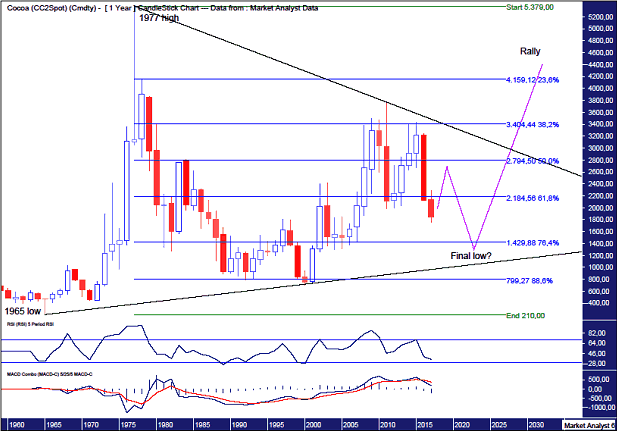
So, the March 2015 analysis called for one final marginal high before a big drop. Check. The 2015 high clipped the 2014 high before turning back down. However, I don't expect the final low now. I now expect a solid bear rally to play out. The longer term outlook remains unchanged in looking for a final low down at least at the 76.4% Fibonacci retracement level at $1429.
Let's now review the monthly chart.
COCOA Monthly Chart
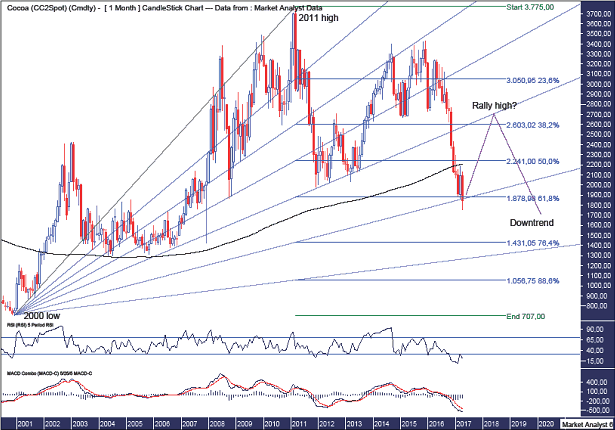
The black line denotes the 200 monthly moving average and price has dipped a bit below thereby giving the support a good test. I expect price to spring back up from here.
I have drawn a Fibonacci Fan from the 2000 low to 2011 high and this low is right at support from the 76.4% angle. I am looking for price to rally back up to the 61.8% which should provide resistance and see in the bear rally high. This level looks to be around the $2700 level a year from now. And perhaps the final low will be back down around support from the 88.6% angle.
I have added Fibonacci retracement levels of the move up from the 2000 low to 2011 high and this low has clipped the 61.8% level which is a common setup for low. I now favour a rally however my target for final low is at least back at the 76.4% level at $1431. Interestingly, this is just $2 away from the 76.4% level from the yearly chart so that should really be am area of serious support.
The RSI made a new low and perhaps the final low will set up a bullish divergence. All in good time.
The MACD indicator remains bearish so caution needs to be heeded by the bulls with stop used.
Now let's look in closer at the daily chart.
COCOA Daily Chart
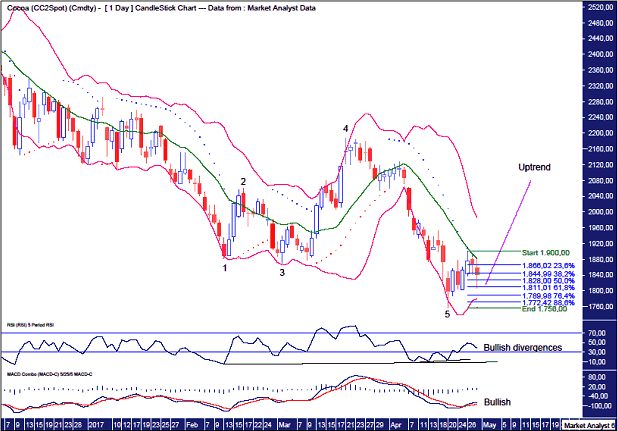
We can see a 5 point broadening low is in place with the recent low at $1756 the point 5 low.
The PSAR indicator is now bullish with the dots beneath price and it would not surprise to see price trade a touch lower to give that support a test.
The Bollinger Bands show price is finding resistance at the middle band. I favour this to be temporary only. We may see price push lower in the meantime. That is, over the next couple of days.
I have added Fibonacci retracement levels of the move up off this low. Price clipped the 61.8% before bouncing but I favour this bounce to be temporary and price to head back down to at least the 76.4% level at $1789. That is where I will be looking for a higher low to form.
The RSI shows multiple bullish divergences forming while the MACD indicator is bullish.
So, price has traded exactly as laid out over two years ago and hopefully that continues going forward from here. A bear rally now for mine.
By Austin Galt
Austin Galt is The Voodoo Analyst. I have studied charts for over 20 years and am currently a private trader. Several years ago I worked as a licensed advisor with a well known Australian stock broker. While there was an abundance of fundamental analysts, there seemed to be a dearth of technical analysts. My aim here is to provide my view of technical analysis that is both intriguing and misunderstood by many. I like to refer to it as the black magic of stock market analysis.
Email - info@thevoodooanalyst.com
© 2015 Copyright The Voodoo Analyst - All Rights Reserved
Disclaimer: The above is a matter of opinion provided for general information purposes only and is not intended as investment advice. Information and analysis above are derived from sources and utilising methods believed to be reliable, but we cannot accept responsibility for any losses you may incur as a result of this analysis. Individuals should consult with their personal financial advisors.
Austin Galt Archive |
© 2005-2022 http://www.MarketOracle.co.uk - The Market Oracle is a FREE Daily Financial Markets Analysis & Forecasting online publication.