


Trump Tax Cut Can Create the Last Stock Market Rally Since 2016
Stock-Markets / Stock Market 2017 May 02, 2017 - 08:36 AM GMT

 As part of President’s Trump campaign pledge, he wants to sharply reduce the tax rate for all businesses from multinational corporations to mom-and-pop shops to 15%. Treasury Secretary Steven T. Mnuchin said this is the biggest tax cut and the largest tax reform in the U.S history. Currently the U.S. corporate tax rate is 35% and it is the highest among developed economies. President Trump also plans to simplify and reduce individual tax rate with the highest individual tax rate dropping to 25%.
The stock market has stalled lately after hitting a record on March 1 due to the worries about soft economic data, the absence of clarity on Trump’s policies, and concern over his failure to push through a healthcare bill. But then last Friday, Trump said he will reveal a “massive” tax package that will deliver cuts “bigger I believe than any tax cut ever.” His statement on Friday was further affirmed by a Saturday tweet
Trump Tax Cut Announcement
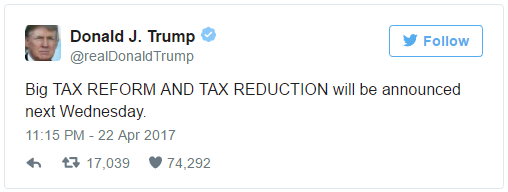
The plan however still faced a long road to enactment and signed into law, as the plan needs to get the approval by Congress and Democrats has expressed doubt about Trump’s plan as fiscally irresponsible. The plan still lacks on details on how to offset the reduced tax revenue, as budget experts believe that the tax cut could cost trillions of dollars in revenue in 10 years, ballooning the government debt. The stock market initial response was favorable and global indices gapped up on the Monday open on April 24. With the much-anticipated tax reform close to reality, investors are emboldened to chase stocks higher and the corporate-friendly tax rate adds upside momentum on the back of upbeat earnings season.
For us at EWF, we know before the news that indices still have more upside due to the bullish Elliott Wave sequence from Feb 2016 low, and we have been telling our members not to sell them and only buy the dips instead. With this latest rally to all-time high, we believe that the stock market rally could be entering the last leg of rally to end the cycle from Feb 2016 low. Let’s take a look at some U.S. stock markets below:
NASDAQ Daily Chart
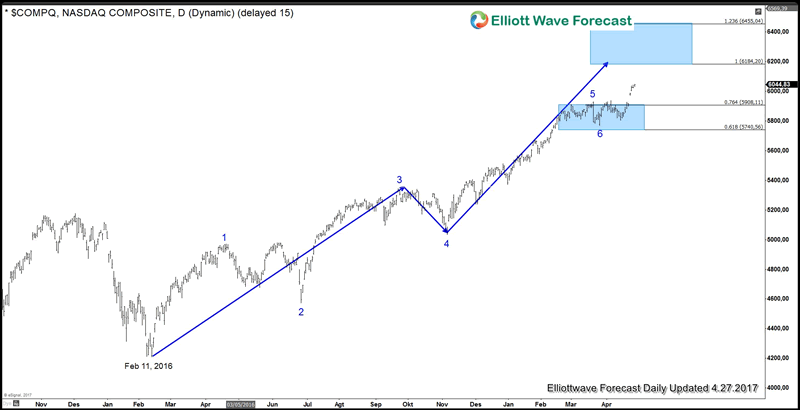
Even before the news, we know that Nasdaq should extend higher as the Elliott wave sequence from Feb 11, 2016 low is showing a 5 swing bullish sequence, which favors more upside. After the news, Nasdaq gapped up then broke to new all-time high but we could see now that the cycle starting from Feb 11, 2016 low should reach extreme area in 7 swing at 6184 – 6455 area. This area could potentially end the cycle from Feb 11, 2016 and when that cycle is over, we could see a pullback in 3, 7, or 11 swing to correct cycle from Feb 11, 2016 low.
Overlay of NASDAQ, RUSSELL, and S&P 500
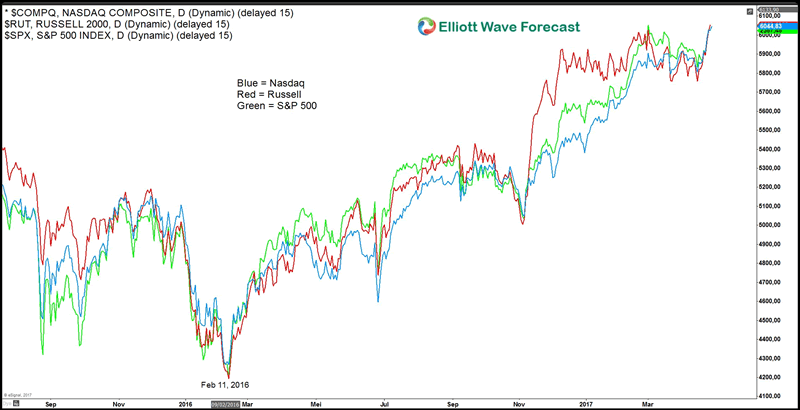
An overlay of the three Indices above shows the same cycle starting from Feb 11, 2016 low, which suggests that the biggest tax cut news could create the last leg rally to end cycle from Feb 11, 2016 before a pull back is seen in the Indices.
By using Elliottwave sequence and cycle technique, we are able to forecast the market ahead of important market-moving news. Get a 24 hours forecast of 52 instrument in 4 time frames, live session, live trading room, 24 hour chat room and more, click EWF 14 days trials to try our services absolutely FREE.
https://elliottwave-forecast.com
ElliottWave-Forecast has built its reputation on accurate technical analysis and a winning attitude. By successfully incorporating the Elliott Wave Theory with Market Correlation, Cycles, Proprietary Pivot System, we provide precise forecasts with up-to-date analysis for 52 instruments including Forex majors & crosses, Commodities and a number of Equity Indices from around the World. Our clients also have immediate access to our proprietary Actionable Trade Setups, Market Overview, 1 Hour, 4 Hour, Daily & Weekly Wave Counts. Weekend Webinar, Live Screen Sharing Sessions, Daily Technical Videos, Elliott Wave Setup .
Copyright © 2017 ElliottWave-Forecast - All Rights Reserved Disclaimer: The above is a matter of opinion provided for general information purposes only and is not intended as investment advice. Information and analysis above are derived from sources and utilising methods believed to be reliable, but we cannot accept responsibility for any losses you may incur as a result of this analysis. Individuals should consult with their personal financial advisors.
© 2005-2022 http://www.MarketOracle.co.uk - The Market Oracle is a FREE Daily Financial Markets Analysis & Forecasting online publication.