


Stock Market Seasonals 60% Probability of Up Week
Stock-Markets / US Stock Markets Aug 17, 2008 - 06:28 AM GMTBy: Mike_Burk

The good news is: Most of the indicators suggest a continuation of the advance.
Short Term Advance - decline lines (ADL) are a running total of declining issues subtracted from advancing issues. Their behavior can vary widely and change over time. For example an ADL calculated from issues traded on the NASDAQ (OTC ADL) has had a negative bias while an ADL calculated from issues traded on the NYSE (NY ADL) used to have a negative bias, but, over the past 10 years or so the bias has become very positive.
I calculated an AD line from the issues in the Dow Jones bond indices and found them it to have an extremely positive bias. (Probably because they would increase in value every day until they made their monthly or quarterly dividend payment) The percentage of interest sensitive issues (bond funds, preferred stock, etc.) on the NYSE has been increasing for years. I have seen reports that claim over 50% of the issues traded on the NYSE are interest sensitive.
When an indicator with a negative bias strengthens it offers an important signal of strength.
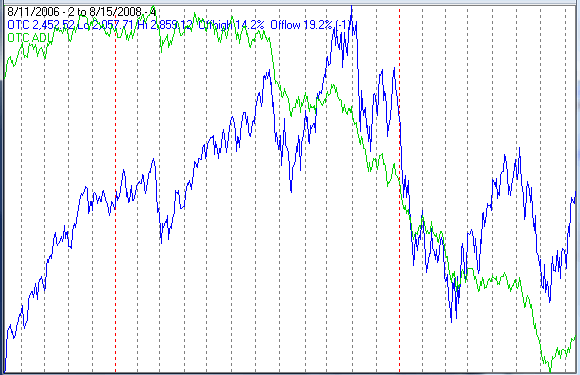
The chart below covers the past 2 year s showing the NASDAQ composite (OTC) in blue and the OTC ADL in green. Dashed vertical lines have been drawn on the 1st trading day of each month, the lines are red on the 1st trading day of the year.
Over the 2 years shown in the chart the indicator has moved from the upper left of the chart to the lower right with brief periods of strength in late 2006, again during the rally off the lows of last August and for the past month.
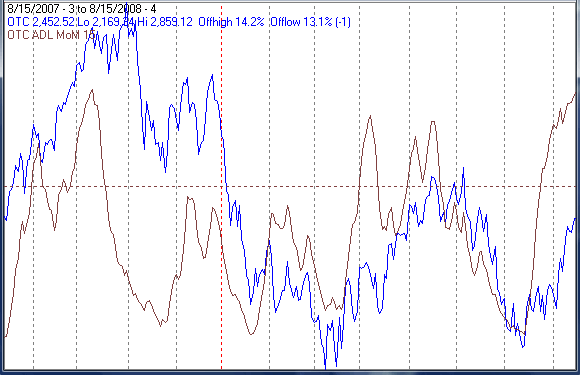
Applying a momentum indicator to the OTC ADL makes it easier to identify its periods of strength.
The chart below covers the past year showing the OTC in blue and momentum of the OTC ADL in black. Indicators with a negative bias deteriorate in advance of tops, and, so far, this indicator is showing no sign of a top.
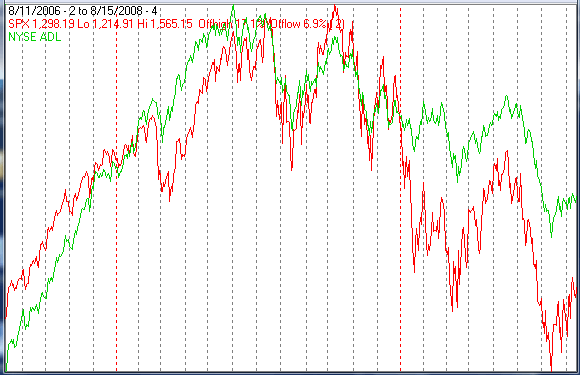
The next chart is similar to the 1st one except is shows the S&P 500 (SPX) in red and the NYSE ADL in green. There is a sharp difference between the OTC ADL and the NYSE ADL. The bias of the NYSE ADL has become so positive that its usefulness has been impaired.
Intermediate Term
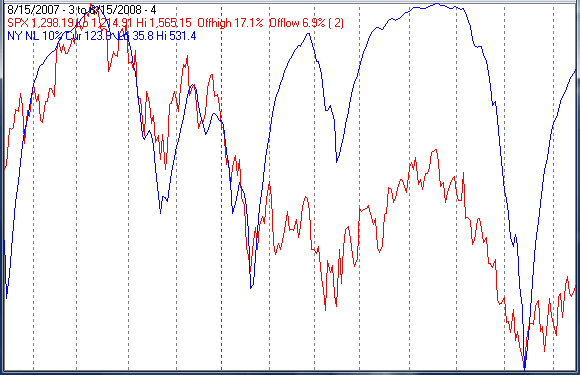
On July 15 there were 1304 new lows on the NYSE, an all time record. On that same day the NASDAQ recorded 491 new lows, not a record, but a lot.
There is usually a retest after an extreme number of new lows and there has always been a retest after a record number of new lows. The record number of new lows on July 15 makes a retest of the July low very likely. The retest could easily mark the end of this bear market because the secondaries have been much stronger than the blue chips and the retest is likely to only be in the blue chip indices
The chart below covers the past year showing the SPX in red and a 10% trend (19 day EMA) of NYSE new lows (NY NL) in blue. NY NL has been plotted on an inverted Y axis so decreasing new lows move the indicator upward (up is good).
The next chart shows the relative performance of the major indices since the July 15 low. The Russell 2000 (R2K) has advanced nearly 3 times as much off the July low as the Dow Jones Industrial Average (DJIA) or the SPX and the OTC advance has been nearly double that of the DJIA or SPX.
Seasonality
Next week is the week prior to the 4th Friday in August during the 4th year of the Presidential Cycle.
The tables show the daily return on a percentage basis for the 5 trading days prior to the 4th Friday in August during the 4th year of the Presidential Cycle. OTC data covers the period from 1963 - 2007 and SPX data from 1953 - 2007. Prior to 1953 the market traded 6 days a week so that data has been ignored. There are summaries for both the 4th year of the Presidential Cycle and all years combined.
By all measures the market has been up about 60% of the time during the coming week with modest gains. Big losses in the mid 70's make the SPX average over all years modestly negative.
Report for the week before the 4th Friday of August.
The number following the year is the position in the presidential cycle.
Daily returns from Monday through the 4th Friday.
| OTC Presidential Year 4 | ||||||
| Year | Mon | Tue | Wed | Thur | Fri | Totals |
| 1964-4 | 0.56% | -0.05% | -0.51% | 0.12% | 0.46% | 0.59% |
| 1968-4 | 0.69% | 0.69% | 0.00% | -0.50% | 0.06% | 0.94% |
| 1972-4 | -0.11% | 0.00% | -0.14% | -0.53% | -0.07% | -0.85% |
| 1976-4 | -0.65% | -0.52% | 0.47% | -0.39% | -0.07% | -1.17% |
| 1980-4 | -1.47% | -0.54% | 0.79% | 1.26% | 0.99% | 1.03% |
| 1984-4 | -0.06% | 1.24% | 0.21% | 0.10% | 0.26% | 1.75% |
| Avg | -0.32% | 0.22% | 0.33% | -0.01% | 0.24% | 0.34% |
| 1988-4 | -0.98% | -0.05% | 0.67% | -0.53% | 0.10% | -0.79% |
| 1992-4 | -1.47% | -0.21% | 0.83% | 0.80% | 0.05% | -0.01% |
| 1996-4 | -0.25% | -0.55% | 0.19% | 1.53% | -0.08% | 0.84% |
| 2000-4 | 0.58% | 0.13% | 1.33% | 1.05% | -0.26% | 2.84% |
| 2004-4 | 0.04% | -0.10% | 1.30% | -0.42% | 0.49% | 1.31% |
| Avg | -0.42% | -0.16% | 0.86% | 0.49% | 0.06% | 0.84% |
| OTC summary for Presidential Year 4 1964 - 2004 | ||||||
| Avg | -0.28% | 0.00% | 0.51% | 0.23% | 0.18% | 0.59% |
| Win% | 36% | 30% | 80% | 55% | 64% | 64% |
| OTC summary for all years 1963 - 2007 | ||||||
| Avg | -0.07% | -0.02% | 0.35% | -0.12% | 0.09% | 0.22% |
| Win% | 42% | 56% | 65% | 53% | 58% | 60% |
| SPX Presidential Year 4 | ||||||
| Year | Mon | Tue | Wed | Thur | Fri | Totals |
| 1956-4 | -1.17% | -0.75% | -0.98% | 1.22% | -0.10% | -1.78% |
| 1960-4 | 0.32% | 0.98% | 0.55% | -0.48% | -0.33% | 1.04% |
| 1964-4 | -0.19% | -0.57% | -0.15% | 0.47% | 0.35% | -0.09% |
| 1968-4 | 0.32% | -0.04% | 0.00% | -0.26% | -0.01% | 0.01% |
| 1972-4 | -0.04% | 0.62% | -0.13% | -1.10% | -0.32% | -0.97% |
| 1976-4 | -0.40% | -0.68% | 0.75% | -0.70% | 0.16% | -0.86% |
| 1980-4 | -1.85% | -0.64% | 0.95% | 1.37% | 0.45% | 0.27% |
| 1984-4 | 0.49% | 1.75% | -0.46% | 0.04% | 0.23% | 2.05% |
| Avg | -0.30% | 0.20% | 0.28% | -0.13% | 0.10% | 0.10% |
| 1988-4 | -1.25% | 0.04% | 1.57% | -0.75% | 0.19% | -0.19% |
| 1992-4 | -1.00% | 0.22% | 0.46% | 0.00% | 0.32% | 0.00% |
| 1996-4 | 0.21% | -0.14% | -0.09% | 0.85% | -0.55% | 0.28% |
| 2000-4 | 0.52% | -0.09% | 0.52% | 0.16% | -0.12% | 0.99% |
| 2004-4 | -0.24% | 0.05% | 0.80% | 0.01% | 0.24% | 0.86% |
| Avg | -0.35% | 0.02% | 0.65% | 0.05% | 0.02% | 0.39% |
| SPX summary for Presidential Year 4 1956 - 2004 | ||||||
| Avg | -0.33% | 0.06% | 0.32% | 0.06% | 0.04% | 0.12% |
| Win% | 38% | 46% | 58% | 62% | 54% | 62% |
| SPX summary for all years 1953 - 2007 | ||||||
| Avg | -0.12% | 0.03% | 0.19% | -0.17% | -0.05% | -0.13% |
| Win% | 44% | 56% | 57% | 45% | 47% | 60% |

Conclusion
The market remains overbought, especially the secondaries, but there has been no significant deterioration of the indicators and the secondaries have stronger than the blue chips.
I expect the major indices to be higher on Friday August 22 than they were on Friday August 15.
Last week the secondaries were up while the blue chips were down slightly so I am calling last week's positive forecast a tie.
By Mike Burk
To subscribe to this report : http://alphaim.net/signup.html
Gordon Harms produces a Power Point for our local timing group. You can get a copy of that at: http://www.stockmarket-ta.com/ .
Disclaimer: Mike Burk is an employee and principal of Alpha Investment Management (Alpha) a registered investment advisor. Charts and figures presented herein are believed to be reliable but we cannot attest to their accuracy. Recent (last 10-15 yrs.) data has been supplied by CSI (csidata.com), FastTrack (fasttrack.net), Quotes Plus (qp2.com) and the Wall Street Journal (wsj.com). Historical data is from Barron's and ISI price books. The views expressed are provided for information purposes only and should not be construed in any way as investment advice. Furthermore, the opinions expressed may change without notice.
Mike Burk Archive |
© 2005-2022 http://www.MarketOracle.co.uk - The Market Oracle is a FREE Daily Financial Markets Analysis & Forecasting online publication.