DOW Set for Short Term Correction
Stock-Markets / Stock Market 2017 May 25, 2017 - 11:08 AM GMTBy: Enda_Glynn
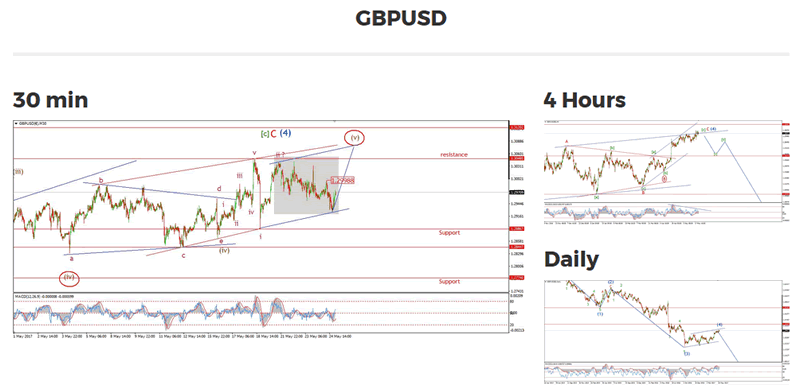
 My Bias: short below parity.
Wave Structure: continuing impulsive structure to the downside in wave (5)
Long term wave count: decline in wave (5) blue, below parity
Important risk events: GBP: Second Estimate GDP q/q, Business Investment q/q. USD: Unemployment Claims, OPEC Meetings

Todays action in cable has not offered any more clues to the validity of either wave count shown on the chart.
The alternate wave count is just as likely following todays sideways grind.
In terms of the action shown in the shaded box,
It is possible that this is an internal corrective 'b' wave,
within the final three wave movement of an ending diagonal wave (v) brown.
That's a handful, I know!
This is yet to be resolved.
So for tomorrow, if the price breaks 1.2998, this action will tip the scales in favor of the alternate wave count circled in red.
Key support remains at 1.2887.

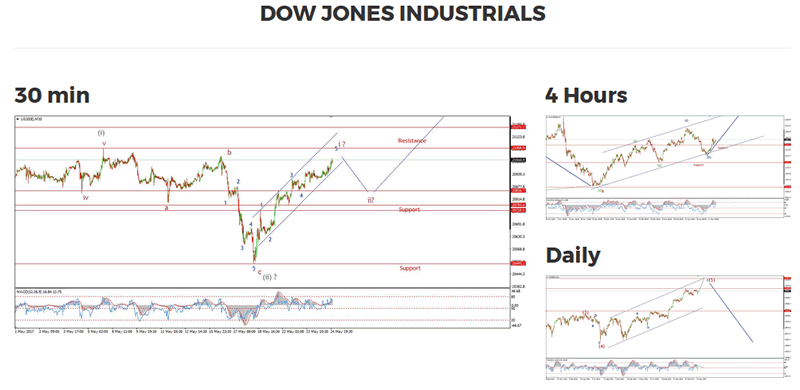
My Bias: market topping process ongoing
Wave Structure: Impulsive 5 wave structure, possibly topping in an all time high.
Long term wave count: Topping in wave (5)
Important risk events: USD: Unemployment Claims, OPEC Meetings.
The recent rally in the DOW has extended in both wave '3' and '5' blue.
Today's rise has probably completed that wave structure in wave 'i' pink.
Resistance at 21068 is drawing the market in at the moment.
A further touch of the trend channel would break that level before the correction in wave 'ii' begins.
The momentum setup on the 4hr chart is very supportive to the rally at the moment.
This suggests a shallow correction in wave 'ii' pink.
If so, 20856 is a likely target in that case.
This is the low of the previous fourth wave of one lesser degree.
Watch for signs of a turn down in wave 'ii' tomorrow.

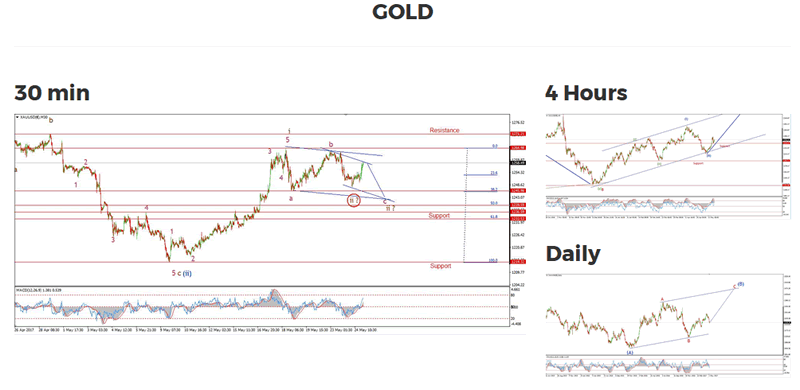
My Bias: Long towards 1550
Wave Structure: ZigZag correction to the upside.
Long term wave count: Topping in wave (B) at 1550
Important risk events: USD: Unemployment Claims, OPEC Meetings.
GOLD rallied today without hitting the minimum target for wave 'c' at 1245.
So far the rise is in three waves, which suggests a minor counter trend rally within wave 'c' pink.
As opposed to the beginning of wave 'iii' brown.
Wave 'ii' may be a running flat correction, which is indicated by the alternate wave count circled in red.
But for now, I prefer a complex correction in wave 'ii' brown.
A complex correction simply forms three movements within each wave tracing out a 3,3,3 structure.
The trend channels still suggest a low in wave 'ii' brown of about 1240.
Lets see how this plays out tomorrow.
Enda Glynn
http://bullwaves.org
I am an Elliott wave trader,
I have studied and traded using Elliott wave analysis as the backbone of my approach to markets for the last 10 years.
I take a top down approach to market analysis
starting at the daily time frame all the way down to the 30 minute time frame.
© 2017 Copyright Enda Glynn - All Rights Reserved
Disclaimer: The above is a matter of opinion provided for general information purposes only and is not intended as investment advice. Information and analysis above are derived from sources and utilising methods believed to be reliable, but we cannot accept responsibility for any losses you may incur as a result of this analysis. Individuals should consult with their personal financial advisors.
© 2005-2022 http://www.MarketOracle.co.uk - The Market Oracle is a FREE Daily Financial Markets Analysis & Forecasting online publication.


