GBPUSD Top in Place, GOLD Price Ready to Rocket?
Stock-Markets / Financial Markets 2017 May 27, 2017 - 12:01 PM GMTBy: Enda_Glynn
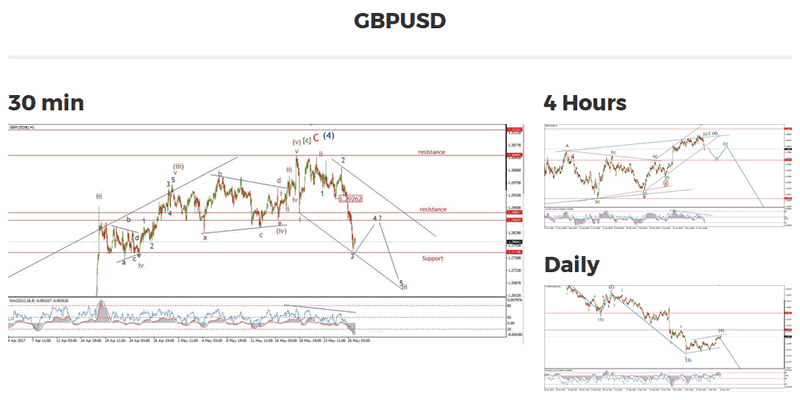
 My Bias: short below parity.
Wave Structure: continuing impulsive structure to the downside in wave (5)
Long term wave count: decline in wave (5) blue, below parity
Important risk events: GBP: N/A. USD: N/A.

Well!
The market finally gave us the action which the main wave count had called for.
That is an impulsive decline in a possible wave '3' grey and a break of that important support line at 1.2865.
The focus has now fully shifted to the downside, and the beginning of a renewed downtrend in wave (5) blue.
The indesision in the wave pattern over the last few days was resolved with a very impulsive third wave down.
Wave '2' grey traced out a running flat correction, a wave which is always throws the cat amongst the pigeons!
At the moment I can count five waves complete 'within wave '3'.
For next week we should get a three wave correction in wave '4' grey and wave '5' grey will likely decline into the trend line once more.
Support at 1.2865 now becomes a significant resistance level and should hold the price down for now.
Look for wave '4' grey to complete below 1.2865 on Monday.

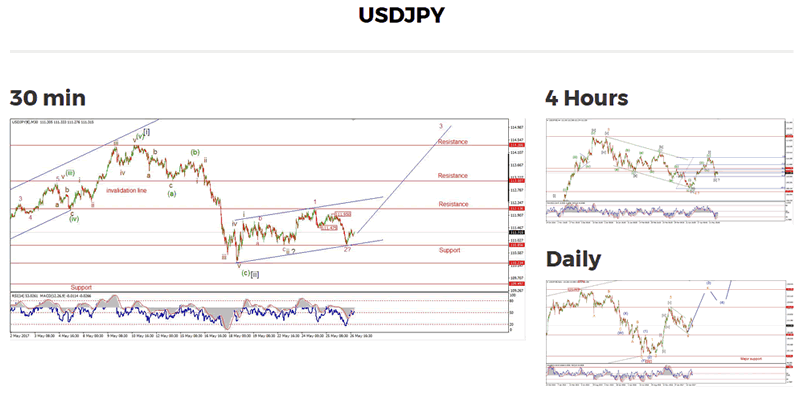
My Bias: LONG
Wave Structure: rally in wave [C]
Long term wave count: wave [C] is underway, upside to above 136.00
Important risk events: JPY: N/A. USD: N/A.
Despite further declines today in USDJPY,
The price did not take out the support at 110.85 which leaves the bullish short term wave count intact.
Today's decline completes a three wave form off the recent high labeled wave '1' pink.
The current wave count still calls for a major rally in wave '3' pink, and the support is at that wave '2' low of 110.85.
If the price breaks 111.95, then wave '3' will likely be underway.
A break of 111.47 strengthen the bullish case in the short term.
In the early trade next week, watch for the key support at 110.85 to hold, and a break of 111.47.

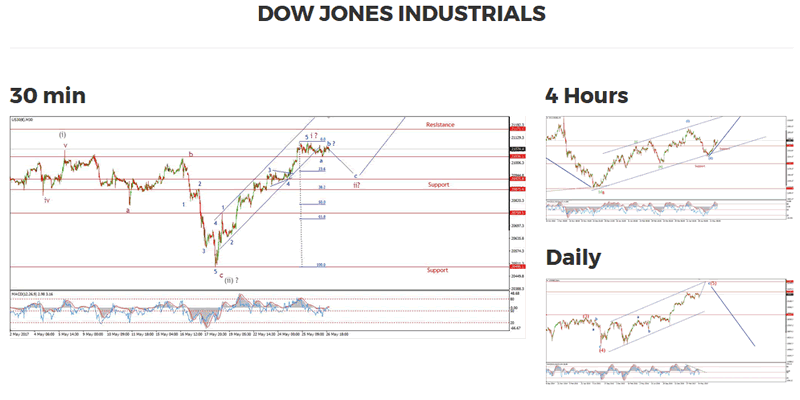
My Bias: market topping process ongoing
Wave Structure: Impulsive 5 wave structure, possibly topping in an all time high.
Long term wave count: Topping in wave (5)
Important risk events: USD: N/A.
The DOW is now moving in a corrective pattern, possibly in wave 'ii' pink.
I have labelled the short term chart as a complete wave 'a' and 'b' in blue.
That leaves wave 'c' blue to the downside to finish off wave 'ii' pink.
I have marked 20925 as the initial target for wave 'c' blue.
This is the low of the previous fourth wave.
20875 marks the Fibonacci 38.2% retracement level.
For Monday, a break of 21037, the wave 'a' low will signal wave 'c' has started.
The low at wave 'ii' pink offers the next best opportunity to enter long.

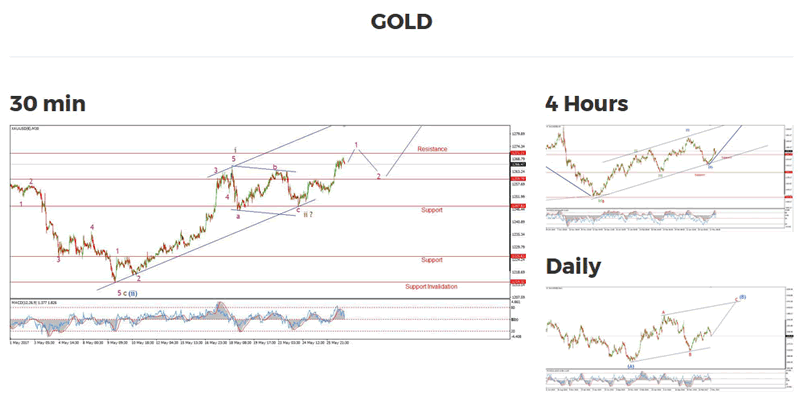
My Bias: Long towards 1550
Wave Structure: ZigZag correction to the upside.
Long term wave count: Topping in wave (B) at 1550
Important risk events: USD: N/A.
Today's rally in GOLD has triggered the alternate wave count for wave 'ii' brown which I had spoken about.
That means wave 'ii' brown traced out a running flat which bottomed at 1247.
The rise off that low now has a nice impulsive look to it,
and one more push up would break the resistance level and create a clear five wave form off the low.
That type of action would complete wave '1' pink.
Wave '2' pink should find support at 1259.
Any break of 1247 form this point will signal that wave 'ii' brown was extending into a more complex form.
For early next week, watch for a break of 1271 to prove the bullish case.
Thats it for this week, I wish you all a happy and peaceful weekend.
It is Memorial Day on Monday, and U.S market is closed, the London market is closed also for the summer bank holiday.
So, I will see you all again after the close on Tuesday the 30th.
Enda Glynn
http://bullwaves.org
I am an Elliott wave trader,
I have studied and traded using Elliott wave analysis as the backbone of my approach to markets for the last 10 years.
I take a top down approach to market analysis
starting at the daily time frame all the way down to the 30 minute time frame.
© 2017 Copyright Enda Glynn - All Rights Reserved
Disclaimer: The above is a matter of opinion provided for general information purposes only and is not intended as investment advice. Information and analysis above are derived from sources and utilising methods believed to be reliable, but we cannot accept responsibility for any losses you may incur as a result of this analysis. Individuals should consult with their personal financial advisors.
© 2005-2022 http://www.MarketOracle.co.uk - The Market Oracle is a FREE Daily Financial Markets Analysis & Forecasting online publication.


