Precious Metals’ Reply to US Dollar’s Small Rally
Commodities / Gold and Silver 2017 Jun 09, 2017 - 05:07 PM GMTBy: P_Radomski_CFA
 Gold, silver and mining stocks finally moved lower after several days of higher prices and one can say the opposite about the USD Index. Was this just a pause or a beginning of a bigger downtrend?
The latter is quite likely and the reasons come from the precious metals charts as well as from the one of the USD Index. In short, the points that we made in the previous alerts this week remain up-to-date, especially those that we discussed yesterday regarding the “when” factor. We will move to this issue in a few minutes and in the meantime, let’s start today’s discussion with gold’s short-term chart (chart courtesy of http://stockcharts.com).
Gold

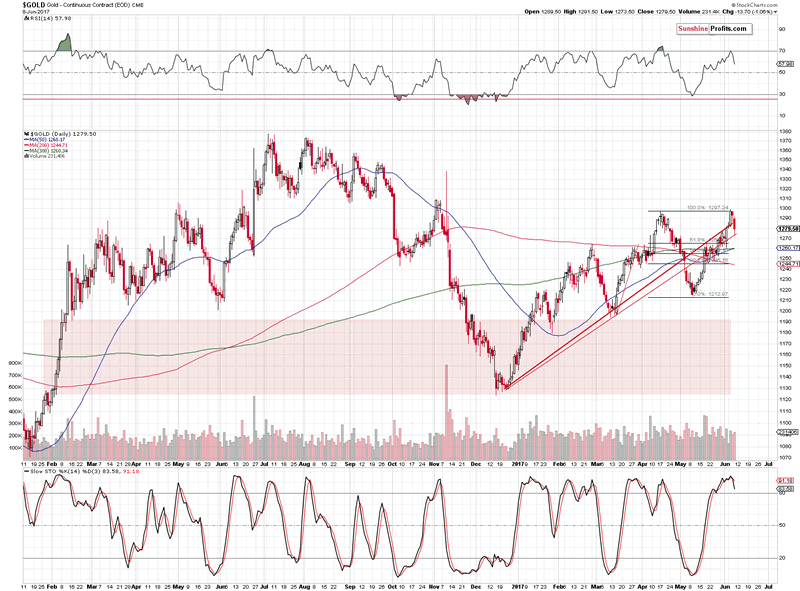
Gold moved visibly below the April highs and also below the rising red support/resistance line based on the daily closing prices. The breakout above it was therefore invalidated.
The RSI moved lower after reaching 70 and the Stochastic indicator flashed a sell signal by moving below its moving average.
In other words, the technical picture for the short term deteriorated based on yesterday’s session. The long-term picture has been bearish and it remains bearish today – yesterday’s session doesn’t seem to have changed much in that regard.

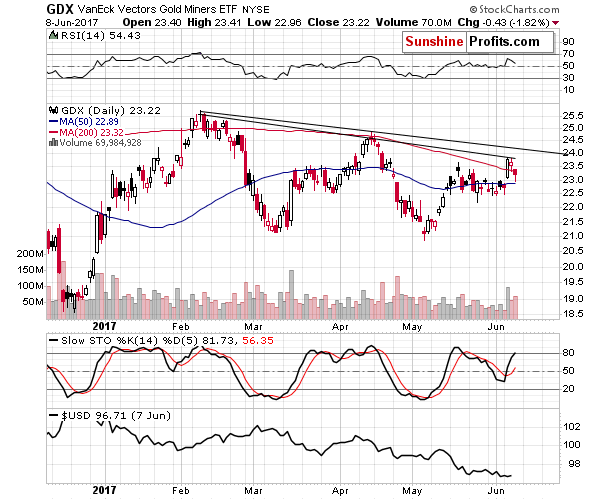
Mining stocks also moved lower on increasing volume, which is a bearish sign on its own. Another sign comes from the closing price – the GDX closed back below the May high (in terms of the daily closing price). That’s important, because that was the only breakout that we’ve seen in miners. They didn’t move above any long-term resistance and they didn’t even move above their declining resistance line that we marked in black on the above chart. With the only breakout being invalidated, the outlook is clearly bearish.
As far as the “Why is the time running out?” question is concerned, the reply is provided on the USD Index chart.
USD Index and Its Implications

In yesterday’s alert we wrote the following:
The cyclical turning point is just around the corner and since all recent major turnarounds took place right before the turning points, it’s likely that the turnaround will be seen shortly. Perhaps, the bottom is already in – the USD Index tested the Fibonacci retracement once again yesterday and there was no breakdown (let alone a confirmed one).
The RSI indicator remains close to the 30 level – the oversold territory, thus suggesting that the next short-term price move should be to the upside.
The USD Index finally moved a bit higher and even though this daily rally is nothing compared to the likely long-term upswing, it is a good start. The important thing is that metals and miners reacted to even a small sign of strength in the USD – this suggests that when the USD rallies further, metals and miners will further deteriorate instead of showing relative strength.
Summing up, even though this week’s price moves may have appeared significant, they actually changed very little. Important resistance levels were reached in gold and gold stocks and an important support was reached in the case of the USD Index. The proximity of the turning point in the USD Index suggests that the time is running out for the market to decide in which way the next move will take place. So, as far as predicting gold’s price is concerned, it seems that the market remains to be in the pennies to the upside and dollars to the downside territory (literally in the case of silver and the GDX) and thus the overall outlook remains bearish.
If you enjoyed the above analysis and would like to receive free follow-ups, we encourage you to sign up for our gold newsletter – it’s free and if you don’t like it, you can unsubscribe with just 2 clicks. If you sign up today, you’ll also get 7 days of free access to our premium daily Gold & Silver Trading Alerts. Sign up now.
Thank you.
Przemyslaw Radomski, CFA
Founder, Editor-in-chief
Tools for Effective Gold & Silver Investments - SunshineProfits.com
Tools für Effektives Gold- und Silber-Investment - SunshineProfits.DE
* * * * *
About Sunshine Profits
Sunshine Profits enables anyone to forecast market changes with a level of accuracy that was once only available to closed-door institutions. It provides free trial access to its best investment tools (including lists of best gold stocks and best silver stocks), proprietary gold & silver indicators, buy & sell signals, weekly newsletter, and more. Seeing is believing.
Disclaimer
All essays, research and information found above represent analyses and opinions of Przemyslaw Radomski, CFA and Sunshine Profits' associates only. As such, it may prove wrong and be a subject to change without notice. Opinions and analyses were based on data available to authors of respective essays at the time of writing. Although the information provided above is based on careful research and sources that are believed to be accurate, Przemyslaw Radomski, CFA and his associates do not guarantee the accuracy or thoroughness of the data or information reported. The opinions published above are neither an offer nor a recommendation to purchase or sell any securities. Mr. Radomski is not a Registered Securities Advisor. By reading Przemyslaw Radomski's, CFA reports you fully agree that he will not be held responsible or liable for any decisions you make regarding any information provided in these reports. Investing, trading and speculation in any financial markets may involve high risk of loss. Przemyslaw Radomski, CFA, Sunshine Profits' employees and affiliates as well as members of their families may have a short or long position in any securities, including those mentioned in any of the reports or essays, and may make additional purchases and/or sales of those securities without notice.
Przemyslaw Radomski Archive |
© 2005-2022 http://www.MarketOracle.co.uk - The Market Oracle is a FREE Daily Financial Markets Analysis & Forecasting online publication.


