Weekly Stock Market Technical Analysis Report - 24th Mar 07
Stock-Markets / US Stock Markets Mar 24, 2007 - 03:45 PM GMTBy: Mike_Burk
The good news is: Last week new lows evaporated. On the NASDAQ new lows declined on both Thursday and Friday in spite of declines in the NASDAQ composite (OTC). The picture was similar on the NYSE with only 7 new lows recorded on Friday.
Short Term
Martin Zweig's up volume indicator got a lot of publicity in technical circles when it was triggered last week. The indicator was also triggered on March 6, but analysts' were probably too afraid to notice that time.
According to Greg Morris in THE COMPLETE GUIDE TO MARKET BREADTH INDICATORS (my bedside reference) "A further concept from Dr. Zweig is to expand the 9-to-1 ratio of up volume to down volume to state that anytime there are two signals in any 3-month period, the evidence suggests a strong market to follow." On March 6 the ratio was 15-to-1 and 10-to-1 last Wednesday. The indicator is calculated on NYSE volume figures.
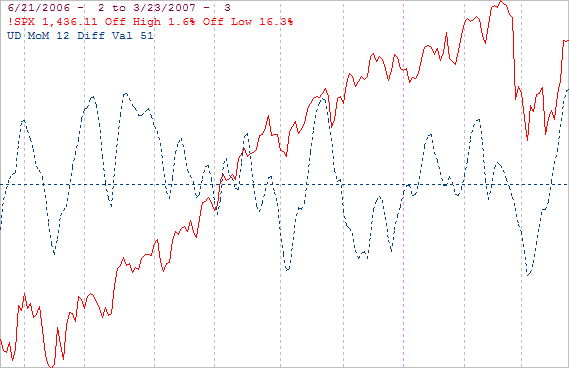
The chart below is offered to temper your exuberance.
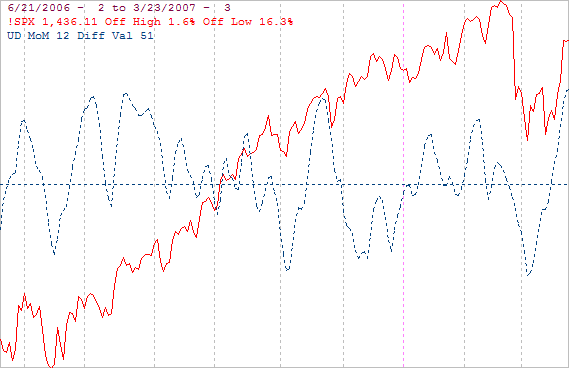
The chart covers the past 9 months showing the S&P 500 (SPX) in red and an indicator calculated by subtracting momentum of downside volume from momentum of upside volume. The volume figures are calculated from the component issues of the SPX.
The indicator is as high as it has been in the past 9 months and the market has usually corrected a little after these levels have been reached.

Intermediate term
A summation index (SI) is a running total of oscillator values. When the oscillator is positive the SI moves upward and when it is negative the SI moves downward.
The chart below shows the OTC in red and SI's calculated from oscillators of NASDAQ advancing issues - declining issues, new highs - new lows and upside volume - downside volume.
This chart is an update of one I showed last week. As you can see, the SI's reversed last week and are all now heading sharply upward.

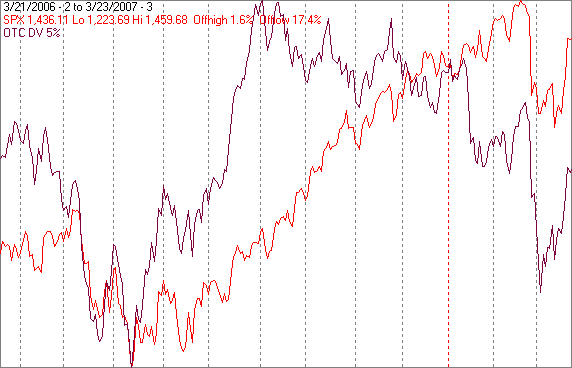
The next chart is also an update from last week covering the past year, showing the OTC in red and a NASDAQ downside volume indicator (OTC DV) in brown. OTC DV is a 5% trend (39 day EMA) of NASDAQ downside volume plotted on an inverted Y axis (up is good). OTC DV rises quickly after a bottom has been reached and happened last week.

Seasonality
Next week includes the last 5 trading days of March.
The tables below show OTC data from 1963 - 2003 during the 3rd year of the Presidential Cycle and SPX data beginning with 1928.
There are summaries for both the 3rd year of the Presidential Cycle and all years combined.
Like last week, the SPX as had a negative bias over all periods for the week while the OTC has had a slightly positive bias during the 3rd year of the Presidential cycle.
Last 5 days of March.
The number following the year represents its position in the presidential cycle.
The number following the daily return represents the day of the week;
1 = Monday, 2 = Tuesday etc.
| OTC Presidential Year 3 | ||||||
| Day5 | Day4 | Day3 | Day2 | Day1 | Totals | |
| 1963-3 | 0.64% 1 | 0.54% 2 | 0.38% 3 | 0.76% 4 | 0.00% 5 | 2.33% |
| 1967-3 | 0.66% 1 | 0.16% 2 | 0.69% 3 | 0.20% 4 | 0.32% 5 | 2.04% |
| 1971-3 | -0.10% 4 | 0.45% 5 | 0.12% 1 | 0.23% 2 | 0.50% 3 | 1.21% |
| 1975-3 | -1.98% 1 | -0.12% 2 | 1.65% 3 | 0.82% 4 | -0.68% 1 | -0.30% |
| 1979-3 | -0.36% 1 | 0.51% 2 | 0.07% 3 | 0.32% 4 | 0.36% 5 | 0.90% |
| 1983-3 | 0.19% 5 | -0.64% 1 | -0.14% 2 | 0.75% 3 | 0.01% 4 | 0.16% |
| Avg | -0.31% | 0.07% | 0.48% | 0.46% | 0.10% | 0.80% |
| 1987-3 | -0.15% 3 | 0.28% 4 | -0.42% 5 | -2.24% 1 | 0.70% 2 | -1.83% |
| 1991-3 | -0.10% 5 | 0.94% 1 | 2.15% 2 | 0.79% 3 | -0.01% 4 | 3.77% |
| 1995-3 | 0.48% 1 | 0.43% 2 | -0.84% 3 | -0.28% 4 | 0.04% 5 | -0.17% |
| 1999-3 | 2.94% 4 | -0.64% 5 | 3.04% 1 | -0.50% 2 | -0.76% 3 | 4.08% |
| 2003-3 | 1.55% 2 | -0.26% 3 | -0.23% 4 | -1.06% 5 | -2.08% 1 | -2.07% |
| Avg | 0.95% | 0.15% | 0.74% | -0.66% | -0.42% | 0.75% |
| OTC summary for Presidential Year 3 1963 - 2003 | ||||||
| Averages | 0.35% | 0.15% | 0.59% | -0.02% | -0.15% | 0.92% |
| % Winners | 55% | 64% | 64% | 64% | 55% | 64% |
| MDD 3/31/2003 3.58% -- 3/30/1987 2.65% -- 3/25/1975 2.09% | ||||||
| OTC summary for all years 1963 - 2006 | ||||||
| Averages | 0.05% | -0.02% | -0.13% | -0.03% | 0.12% | -0.01% |
| % Winners | 50% | 52% | 59% | 57% | 63% | 57% |
| MDD 3/30/2000 10.18% -- 3/27/1980 7.82% -- 3/29/2001 7.69% | ||||||
| SPX Presidential Year 3 | ||||||
| Day5 | Day4 | Day3 | Day2 | Day1 | Totals | |
| 1931-3 | -1.35% 4 | -1.88% 5 | -2.15% 6 | -1.07% 1 | 0.18% 2 | -6.27% |
| 1935-3 | -0.83% 2 | 1.08% 3 | 0.12% 4 | 0.00% 5 | 0.24% 6 | 0.60% |
| 1939-3 | -0.42% 1 | -1.33% 2 | 0.76% 3 | -3.44% 4 | -4.60% 5 | -9.03% |
| 1943-3 | 0.80% 5 | 0.27% 6 | 1.41% 1 | 0.87% 2 | -0.09% 3 | 3.26% |
| 1947-3 | 1.40% 3 | 1.12% 4 | -0.45% 5 | -0.13% 6 | -0.91% 1 | 1.01% |
| 1951-3 | -0.09% 2 | -1.16% 3 | 0.33% 4 | 0.70% 5 | -0.37% 6 | -0.60% |
| 1955-3 | 0.08% 5 | -0.35% 1 | 0.05% 2 | -0.90% 3 | 0.16% 4 | -0.95% |
| 1959-3 | 0.16% 2 | -0.14% 3 | -0.21% 4 | -0.56% 1 | -0.02% 2 | -0.77% |
| 1963-3 | 0.03% 1 | 0.29% 2 | 0.42% 3 | -0.15% 4 | -0.02% 5 | 0.57% |
| Avg | 0.32% | -0.05% | 0.03% | -0.21% | -0.23% | -0.14% |
| 1967-3 | -0.08% 1 | 0.04% 2 | -0.20% 3 | -0.03% 4 | -0.55% 5 | -0.82% |
| 1971-3 | -0.01% 4 | 0.34% 5 | 0.08% 1 | 0.23% 2 | 0.05% 3 | 0.69% |
| 1975-3 | -2.36% 1 | 0.79% 2 | 1.86% 3 | 0.31% 4 | -0.58% 1 | 0.01% |
| 1979-3 | -0.55% 1 | 1.43% 2 | -0.35% 3 | -0.09% 4 | -0.43% 5 | 0.00% |
| 1983-3 | -0.46% 5 | -0.54% 1 | -0.17% 2 | 1.19% 3 | -0.28% 4 | -0.26% |
| Avg | -0.69% | 0.41% | 0.24% | 0.32% | -0.36% | -0.07% |
| 1987-3 | -0.42% 3 | 0.18% 4 | -1.60% 5 | -2.34% 1 | 0.86% 2 | -3.31% |
| 1991-3 | 0.25% 5 | 0.64% 1 | 1.75% 2 | -0.25% 3 | -0.03% 4 | 2.35% |
| 1995-3 | 0.45% 1 | 0.14% 2 | -0.15% 3 | -0.18% 4 | -0.30% 5 | -0.05% |
| 1999-3 | 1.69% 4 | -0.56% 5 | 2.14% 1 | -0.72% 2 | -1.11% 3 | 1.44% |
| 2003-3 | 1.22% 2 | -0.55% 3 | -0.16% 4 | -0.58% 5 | -1.77% 1 | -1.85% |
| Avg | 0.64% | -0.03% | 0.39% | -0.81% | -0.47% | -0.28% |
| SPX summary for Presidential Year 3 1931 - 2003 | ||||||
| Averages | -0.03% | -0.01% | 0.18% | -0.38% | -0.50% | -0.73% |
| % Winners | 47% | 58% | 53% | 26% | 26% | 47% |
| MDD 3/31/1939 8.80% -- 3/30/1931 6.30% -- 3/30/1987 4.12% | ||||||
| SPX summary for all years 1928 - 2006 | ||||||
| Averages | -0.10% | -0.02% | -0.03% | 0.00% | -0.17% | -0.32% |
| % Winners | 34% | 49% | 54% | 44% | 42% | 51% |
| MDD 3/31/1938 9.09% -- 3/31/1939 8.80% -- 3/31/1932 7.00% | ||||||
The Alpha Fund (APHAX)
The Alpha Fund, which I manage, opened last October.
Last week YTD
APHAX +0.9% +2.82%
For information about the fund go to: http://www.thealphafunds.com/index.htm . The fund now has service class shares available.
Conclusion
Last week new lows declined to benign levels. Seasonally next week has been weak but the level of new lows suggests there is not much risk.
I expect the major indices to be higher on Friday March 30 than they were on Friday March 23.
Last week's negative forecast based on high levels of new lows modest seasonal weakness was a miss.
By Mike Burke
Mike Burk is an employee and principle of Alpha Investment Management (Alpha) a registered investment advisor. Charts and figures presented herein are believed to be reliable but we cannot attest to their accuracy. The views expressed are provided for information purposes only and should not be construed in any way as investment advice. Furthermore, the opinions expressed may change without notice. To subscribe to this report : http://alphaim.net/signup.html
© 2005-2022 http://www.MarketOracle.co.uk - The Market Oracle is a FREE Daily Financial Markets Analysis & Forecasting online publication.


