


US Stock Market Correction Appears to be Underway
Stock-Markets / Stock Market 2017 Jul 01, 2017 - 08:03 PM GMTBy: Tony_Caldaro

 The market started this volatile week at SPX 2438. After a gap up opening on Monday the market rallied to SPX 2450 before reversing into a 2419 low of Tuesday. Wednesday provided another gap up opening as the SPX hit 2443. After retesting that high early Thursday the market sold off to SPX 2406 before reversing into the close. Friday had another gap up opening as the market rallied to SPX 2433, before declining to 2423 to end the week. For the week the SPX/DOW lost 0.40%, and the NDX/NAZ lost 2.35%. Economic reports were slightly positive. On the downtick: durable goods, Case-Shiller, pending home sales, the Q2 GDP estimate, the WLEI, plus weekly jobless claims rose. On the uptick: consumer confidence/sentiment, Q1 GDP, personal income/spending, the CPI and the Chicago PMI. Next week, shortened by the 4th July holiday, we’ll get reports on Payrolls, the ISMs, and the FOMC minutes. Best to your weekend!
LONG TERM: uptrend
A Super cycle, in Elliott Wave terms, lasts about 70-80 years. This is also about 1 degree of the Earth’s 25,920-year Precession cycle: https://en.wikipedia.org/wiki/Precession, and the length of a 4-generation full Saeculum cycle: https://en.wikipedia.org/wiki/Strauss%E2%80%93Howe_generational_theory. In modern times, all three of these cycles last about the length of one lifetime. What this implies is that the Earth, the human collective, and its economic cycles all move in unison over long periods of time.
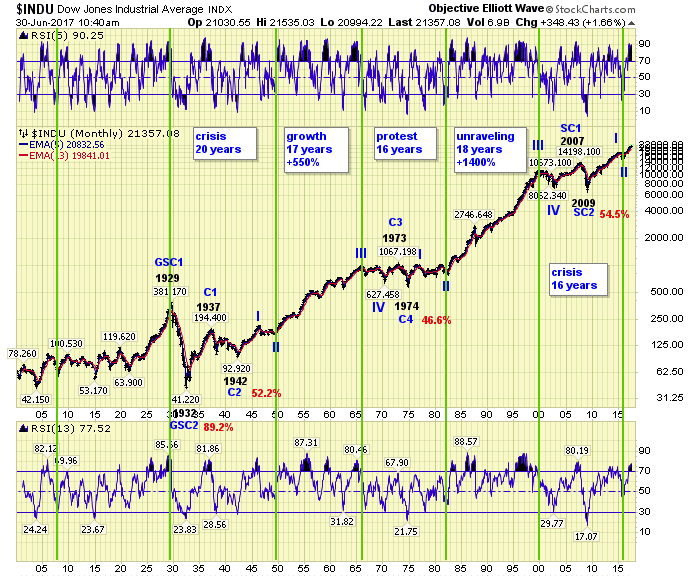
The Saeculum cycle subdivides into four secular/generational cycles: growth, protest, unraveling, and crisis. The Super cycle subdivides into five Cycle waves, i.e. 1937-1942-1973-1974-2007. In modern times, using quantitative Elliott waves, it is quite easy to observe how these two cycles relate to each other during 1 degree of the Precession cycle. When the synchronization of the planet, it’s inhabitants, and their output is observed, it removes a lot of doubt, and provides a lot of important information.
We continue to label, as we have for a number of years now, the 2009 SPX 667 low as the end of the Great Recession and Super cycle 2. At that point the 70-80 year Super cycle 3 began. The first bull market after that low lasted until 2015 when the SPX reached 2135. That high is labeled Primary I of Cycle wave 1. The bear market that followed into early 2016 reached a low of SPX 1810, and we labeled it Primary wave II. Primary III started at that low.
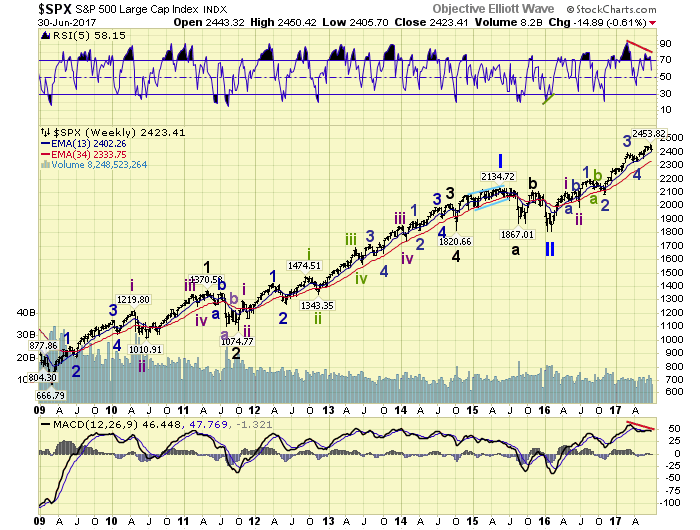
Since Primary III’s tend to be quite long in duration (see monthly chart above). We have started the labeling of the quantified medium term trends, during this bull market, expecting it to end with a Major wave 1 high. Thus far, Intermediate waves i and ii ended in the spring of 2016. Minor waves 1 and 2, of Int. iii, ended in the fall of 2016. Minor waves 3 and 4 ended in the spring of 2017. And Minor wave 5, completing Int. iii, probably ended this month at SPX 2454. After an Int. iv correction the market should then rise to all-time new highs during Int. wave v. We have been estimating a Major wave 1 high at SPX 3000+ between the years 2018 and 2020.
MEDIUM TERM: uptrend topped?
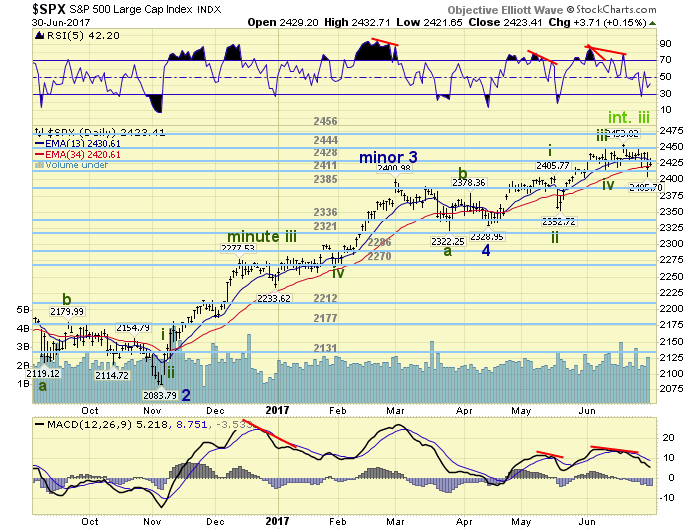
The Minor wave 5 uptrend, from the mid-April Minor 4 low at SPX 2329, appears to have ended in mid-June at SPX 2454. We have been counting five Minute waves up: 2406-2353-2446-2419-2454, along with a series of RSI/MACD negative divergences on daily and some weekly timeframes. This completed uptrend should end a five wave formation from the June 2016 SPX 1992 low, to complete Intermediate wave iii of this bull market.
When the downtrend is confirmed we should then start looking for an Int. wave iv low. Cycles suggest a correction low sometime in September. If this is correct there should be a lot of choppy activity between now and then. The wave pattern for Int. iii suggests initial support should appear around the Minor 4 April lows, i.e. the OEW 2321 pivot. Should that fail to hold, the next support is around the February lows, i.e the OEW 2270 and 2286 pivots.

When reviewing the NDX/NAZ, which have been leading the general market lower. We find that their Intermediate wave ii low occurred in November 2016 at their weekly 34EMA, with an oversold RSI. Should their Int. iv follow the same pattern its low should hit the weekly 34EMA.
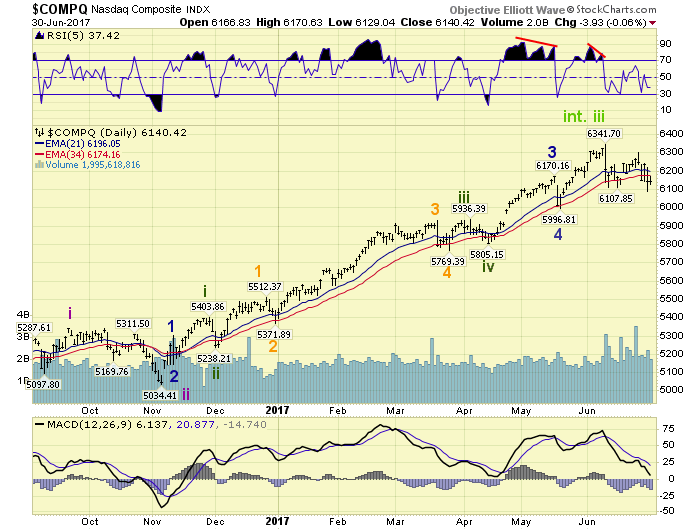
That level is currently around the mid-April lows as well. Which also happens to be around the level of two fourth waves of a lesser degree that somewhat formed a double bottom. Medium SPX support is at the 2411 and 2385 pivots, with resistance at the 2428 and 2444 pivots.
SHORT TERM
As noted earlier Minor 5 unfolded in five Minute waves: 2406-2353-2446-2419-2454. On the smallest timeframe we track: Minute i was 9-waves, Minute iii was 5-waves, and Minute v was just 1-wave. This week’s decline dropped below the Minute iv low at SPX 2419, and touched the Minute i high at 2406. This clearly suggests the 5-wave uptrend pattern has completed.
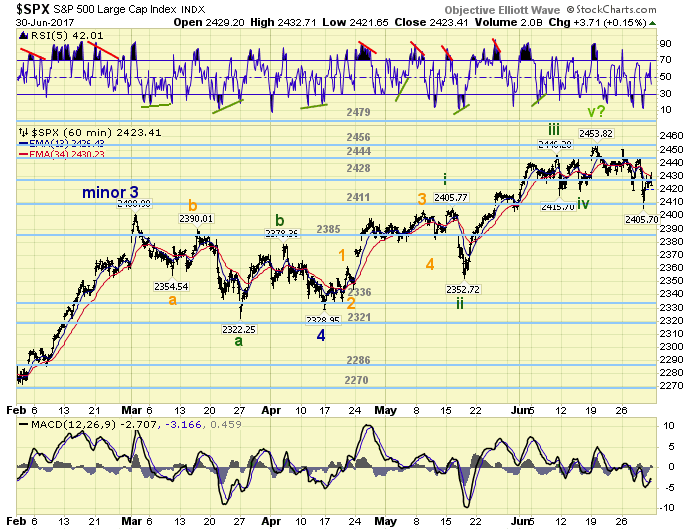
After the SPX 2454 Int. iii high we have observed a decline of overlapping waves on both timeframes: 2431-2450-2419-2443-2406-2433. This is typical correction activity. Notice how the lower highs are creating resistance levels as the decline unfolds. Also of note, the first significant decline found support at the SPX 2419 Minute iv low. The next decline found support at the SPX 2406 Minute i high. Support for the next decline would appear to be the SPX 2353 Minute ii low. Short term support is at the 2411 and 2385 pivots, with resistance at the 2428 and 2444 pivots. Short term momentum ended the week just below neutral.
FOREIGN MARKETS
Asian markets were mostly higher on the week for a gain of 0.2%.
European markets were all lower for a loss of 1.9%.
The DJ World index lost 0.3%, but the NYSE gained 0.2%.
COMMODITIES
Bonds appear to have started a downtrend and lost 1.1% on the week.
Crude is still in a downtrend but gained 7.0%.
Gold appears to be in a downtrend and lost 1.1%.
The USD is still in a downtrend and lost 1.6%.
NEXT WEEK
Monday: ISM, construction spending and auto sales at 10am. Tuesday: national holiday. Wednesday: factory orders and the FOMC minutes. Thursday: jobless claims, the trade deficit, ISM services and the ADP. Friday: monthly Payrolls.
CHARTS: http://stockcharts.com/public/1269446/tenpp
After about 40 years of investing in the markets one learns that the markets are constantly changing, not only in price, but in what drives the markets. In the 1960s, the Nifty Fifty were the leaders of the stock market. In the 1970s, stock selection using Technical Analysis was important, as the market stayed with a trading range for the entire decade. In the 1980s, the market finally broke out of it doldrums, as the DOW broke through 1100 in 1982, and launched the greatest bull market on record.
Sharing is an important aspect of a life. Over 100 people have joined our group, from all walks of life, covering twenty three countries across the globe. It's been the most fun I have ever had in the market. Sharing uncommon knowledge, with investors. In hope of aiding them in finding their financial independence.
Copyright © 2017 Tony Caldaro - All Rights Reserved Disclaimer: The above is a matter of opinion provided for general information purposes only and is not intended as investment advice. Information and analysis above are derived from sources and utilising methods believed to be reliable, but we cannot accept responsibility for any losses you may incur as a result of this analysis. Individuals should consult with their personal financial advisors.
Tony Caldaro Archive |
© 2005-2022 http://www.MarketOracle.co.uk - The Market Oracle is a FREE Daily Financial Markets Analysis & Forecasting online publication.