


The Fed’s Manipulations Have Rendered The Yield Curve Useless As a Recession Indicator
Interest-Rates / US Interest Rates Aug 03, 2017 - 05:38 AM GMTBy: John_Mauldin

 The yield curve has always had an excellent forecasting record.
The Fed’s own wacky policies may have skewed this early-warning system’s reliability, but an interpretive adjustment can restore its usefulness.
This indicator has allowed me to predict the last two recessions.
Here’s what it tells us now—and here’s why you should interpret it through a slightly different lens.
Why The Yield Curve Is No Longer What It Used to Be
The yield curve is simply a chart showing Treasury yields on the vertical axis and maturity on the horizontal axis.
Below is how it looked at mid-year 2017.
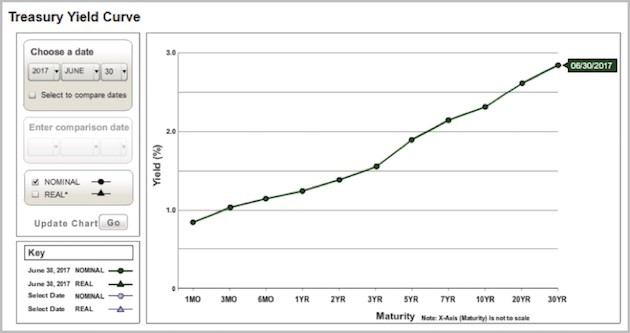
Source: Treasury.gov
Bond traders keep a close eye on the yield curve, and especially on changes in its shape. The curve above is fairly normal. Other things being equal, you expect interest rates to slope upward as time to maturity increases.
That’s because lenders demand higher rates to compensate for the higher risk that comes with lending money for longer periods. The longer you let a borrower hold your cash, the greater the chance something bad will happen to it.
The yield curve’s angle is important, too. It gets steeper when lenders perceive greater risks to long-term loans because, for example, they expect inflation to rise. It’s flatter if inflation risk seems low.
Now, compare the one above with the yield curve of Nov. 30, 2006.
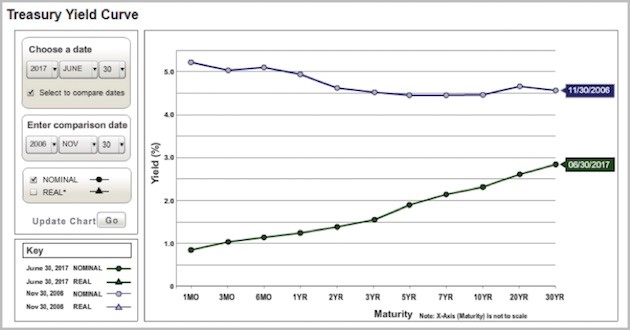
Source: Treasury.gov
Note that yields across the whole curve were higher than they are now. More importantly, the curve is inverted, meaning the short end is actually higher than the long end. At that point investors demanded higher yields for 1-month loans than they did for 30-year loans.
The inverted yield curve historically shows up only when the economy is in a recession or soon will be. An inverted yield curve doesn’t cause a recession but does indicate unusual stress in the market.
Lenders presume the Fed will reduce rates soon, so demand increases for longer-term bonds whose rates are locked in. High demand pushes their prices higher and yields lower. The opposite happens at the short end, so those rates rise, and the curve flattens or inverts.
The inverted yield curve is a classic recession indicator. It inverted in early 2000, right after the Y2K scare proved unfounded and the dot-com bubble was starting to burst. It inverted again in 2006–2007.
Now, since the yield curve is not presently inverted, why am I worried? Because it no longer tells us what it once did.
Short-End Manipulation
Look again at the June 30 yield curve. Now, let’s roll forward to July 20. Direct your attention to the red arrow, where we see a slight inversion forming.
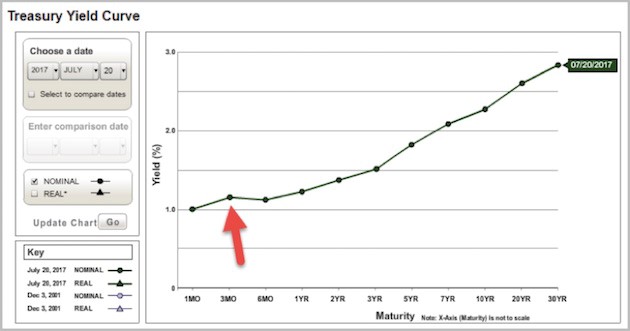
Source: Treasury.gov
On that day, the 3-month Treasury yield exceeded the 6-month yield. It still does today. Why would that be? Well, yields rise (and prices fall) when supply exceeds demand. So fewer people seem to want those 3-month bills.
When is three months from July? That would be October, when there is a fair chance that the US will be embroiled in another debt-ceiling/government-shutdown scenario. T-bills maturing in that period face a slight risk of delayed payment.
The odds are low but still enough to show up in T-bill yields.
US Treasury bills are probably the most liquid fixed-income instruments on the planet. Few markets are more efficient than this one.
Generating this kind of outlier spread isn’t easy, but our crazy political situation is doing it.
The Yield Curve 2.0
The Federal Reserve's tampering at the short end of the yield curve has rendered this traditional predictive device useless.
We have to adapt.
With that in mind, it’s important to note that the 5-year/30-year yield spread has been tightening coincidentally with a slowdown in GDP growth from already low levels. There is the potential for a move from where the curve is now to inversion within a year. Attention must be paid. An outright recession would likely follow, but we’ll feel a downdraft whether the data fits the formal criteria or not.
It’s tough to state that there will be another recession without having the tools to really give a firm prediction. We just don’t have enough good research; so we must be more vigilant, especially in this time of stretched valuations and market sensitivity.
The good news: the yield curve can still be our early warning indicator, with the proviso that we ignore the short maturities and watch the 5-year/30-year spread or maybe even the 5-year/20-year.
You can monitor this yourself by checking T-bond yields on most financial news sites. Find the 30-year yield (or 20) and subtract the 5-yield from it. Right now, the difference is around 1.1 percentage points.
The lower it goes, the closer recession may be.
Join hundreds of thousands of other readers of Thoughts from the Frontline
Sharp macroeconomic analysis, big market calls, and shrewd predictions are all in a week’s work for visionary thinker and acclaimed financial expert John Mauldin. Since 2001, investors have turned to his Thoughts from the Frontline to be informed about what’s really going on in the economy. Join hundreds of thousands of readers, and get it free in your inbox every week.
John Mauldin Archive |
© 2005-2022 http://www.MarketOracle.co.uk - The Market Oracle is a FREE Daily Financial Markets Analysis & Forecasting online publication.