Gold Direction Indicator
Commodities / Gold and Silver 2017 Aug 19, 2017 - 01:53 PM GMTBy: Peter_Degraaf
 The last time our ‘ Gold Direction Indicator’ was as positive as today, gold rose from $1220 to $1280. The date was July 12th and we wrote an article titled: “The Gold Direction Indicator Just Turned Positive”. Less than three weeks later price had advanced by $60. Well here we are, and the GDI just turned up from 52% to 79% (fully bullish). Following are some charts that support a Rising Precious Metals Scenario.
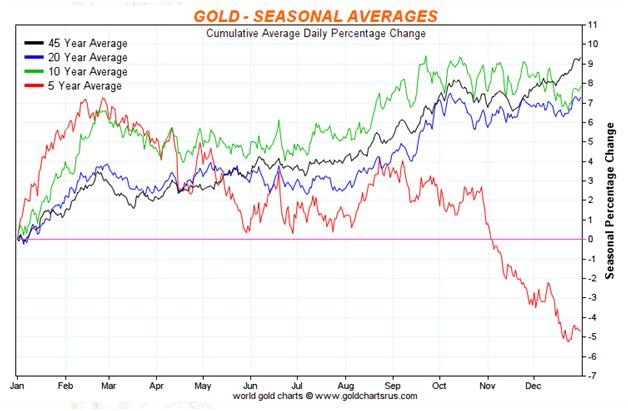
This chart courtesy goldchartsrus.com shows the seasonal tendencies for gold. Disregarding the 5 year trend, (red line), because it includes a four-year long correction – (now ended), we see a steady historical uptrend in three different measures, all beginning in the month of August.
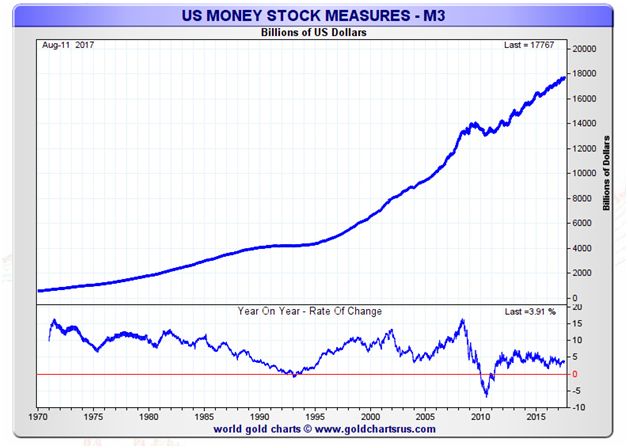
This chart is also courtesy goldchartsrus.com and it shows US M3 Money supply continues to rise. The more money in the system (monetary inflation), the higher prices will rise for items that cannot be produced at will, such as silver and gold (price inflation).
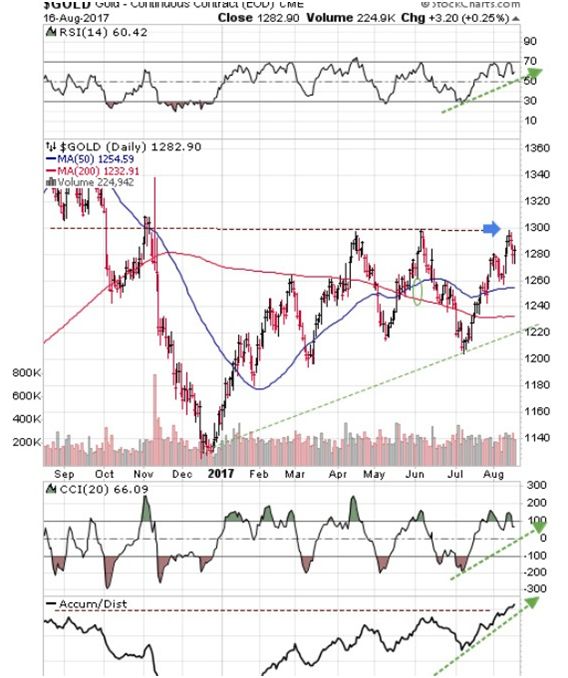
Featured is the daily gold chart. Price is oscillating around the $1280 level. A breakout at the blue arrow will be a very bullish signal. The supporting indicators are positive, including the A/D line at the bottom – it has already broken out to the upside. The moving averages have been in positive alignment (blue line above red line), since late May.
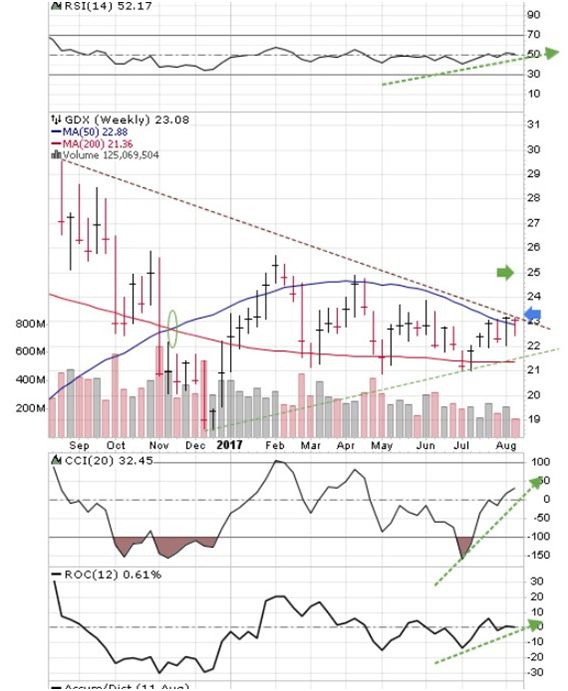
Featured is the weekly bar chart for GDX, the miners ETF. Price is carving out a large triangle, and the supporting indicators are positive. The moving averages have been in positive alignment since November. A breakout at the blue arrow appears to be just days away, and it will turn the trend very bullish, with an initial target at the green arrow.
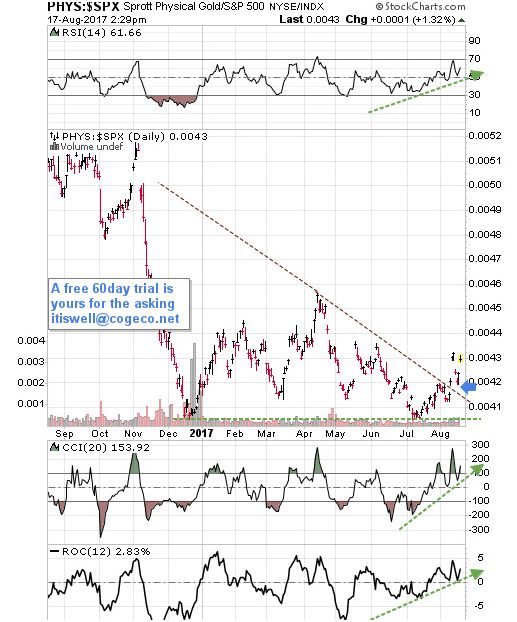
Featured is a chart that compares PHYS the Sprott gold trust, to the US stock market. The pattern is a large triangle, and price is breaking out on the upside. If this trend continues, it will cause money to leave the stock market and move into gold.
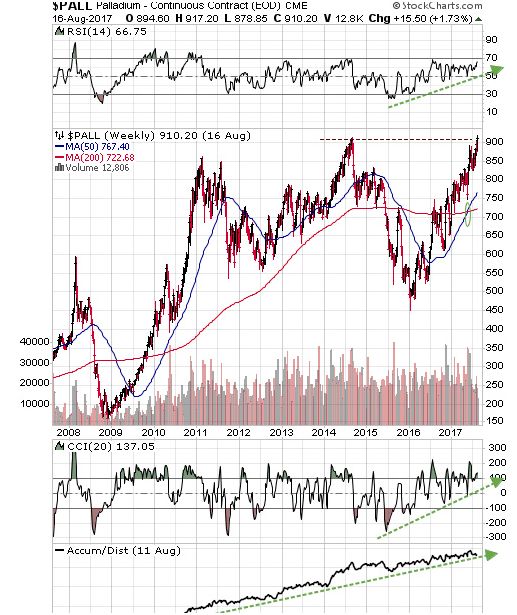
Featured is the ten year Palladium chart. Price is breaking out to a 10 year high level. Palladium is often a leading indicator for the precious metals sector. The supporting indicators are positive and the moving averages are in positive alignment and rising.
Summary: The stage is set for a possible upside breakout in the price of gold and mining stocks, and the seasonal trends are in support. As always, use protective sell stops beneath your long positions, to protect profits.
Peter Degraaf is NOT responsible for your trading decisions. Please do your own due diligence.
By Peter Degraaf
Peter Degraaf is an on-line stock trader with over 50 years of investing experience. He issues a weekend report on the markets for his many subscribers. For a sample issue send him an E-mail at itiswell@cogeco.net , or visit his website at www.pdegraaf.com where you will find many long-term charts, as well as an interesting collection of Worthwhile Quotes that make for fascinating reading.
© 2017 Copyright Peter Degraaf - All Rights Reserved
DISCLAIMER:Please do your own due diligence. Investing involves taking risks. I am not responsible for your investment decisions.
Peter Degraaf Archive |
© 2005-2022 http://www.MarketOracle.co.uk - The Market Oracle is a FREE Daily Financial Markets Analysis & Forecasting online publication.


