3 Reasons The Stock Market Is Nowhere Near A Crisis
Stock-Markets / Stock Market 2017 Aug 31, 2017 - 03:21 PM GMTBy: John_Mauldin
 Bearish investors see many reasons to be cautious now and little grounds for optimism. Others are stalwartly bullish. Naturally, I have friends on both sides of this debate, people with deep knowledge and experience.
Problem is, they can’t all be right. The stock market will move up or down (or possibly sideways), and some of us will be wrong.
Now, let’s see what the bulls have to say.
Dow Theory Still Bullish
Longtime readers know how much I admired the late Richard Russell, editor of Dow Theory Letters. Richard stuck to his methodology despite his own misgivings. By its nature, Russell’s version of the Dow Theory gives very long-term buy and sell signals.
Richard left us in 2015, but other analysts follow strategies similar to his.
According to newsletter tracker Mark Hulbert, these analysts are now uniformly bullish. Benchmarks confirmed the bull market by reaching new highs this summer.
One question remains. Dow Theory looks at the relationship between the Dow industrials and transports averages, and the transports have pulled back since mid-July.
That shift might mark the beginning of a bigger downturn, or it might not. Here’s how Hulbert explains it:
Ominous though this sounds, however, Moroney and the other Dow Theorists I track are still bullish. That’s because the stock market must jump over three successive hurdles to generate a bear-market signal, and it hasn’t even cleared the first.
Those three steps are:
1. Both the Dow Jones Industrial Average and the Dow Jones Transportation Average must undergo a “significant” decline after hitting new highs – “significant” both in terms of time and magnitude.
2. In their subsequent “significant” rally following the decline referred to in step No. 1, either one or both of these Dow averages must [fail] to surpass their highs.
3. Both averages must then fall below their lows registered at the bottom of the decline referred to in step No. 1.
Notice that I put “significant” in quotes. That’s because there isn’t universal agreement on what magnitude of market moves is necessary to satisfy. Some Dow Theorists argue that, per Hamilton’s original indications, a move under the first step isn’t “significant” unless it lasts at least three weeks and corrects at least one-third of its previous move. On this interpretation, the market hasn’t come close to that first step.
Depending how you look at it, then, the Dow Theory signal is either in full-on bull market mode or might be taking a small step back.
In either case, it is nowhere near bearish, and Dow Theory followers see no reason to sell. If anything, by their lights they should be buying more.
Elliott Wave Hangs On, Too
The Elliott Wave Principle, all the rage in the 1980s, is less influential now but is still watched by the technical analysis team at Goldman Sachs.
The Elliott Wave comprises sequential upward and downward market moves—“waves”—that form repeating cycles. A full cycle has 8 waves. Waves 1–5 are bullish, with only minor pullbacks between.
Waves 6–8 are corrective, or bearish, and you do not want to be long when they happen.
The market is presently in wave 4, according to Goldman market technician Sheba Jafari. That means the next downturn will be limited and followed by another bullish wave. Then we would see a bigger correction.
Jafari explains this analysis with the following chart, recently published in Business Insider week.
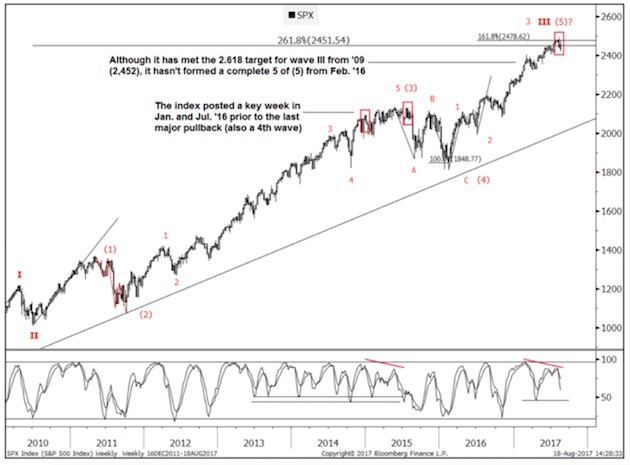
Like Dow Theory, Elliott Wave is very long term. The correction between waves 4 and 5 could last a year or more. The bullish wave 5 could last another year after that.
By this view, we are still a couple of years away from a major bear market, with profits still to be made on the long side.
Am I convinced? No. But serious people are, and you should know what they’re thinking.
All About the Profits
Let’s look at the fundamentals. When you buy a stock, you are really buying its future earnings: Each share’s price is the discounted present value of its expected future earnings.
Prices change when expectations change, which happens for many different reasons.
The present bull market is still with us in large part because earnings are pretty good. With most of the second-quarter reports now in, FactSet reported in its August 11 letter a 10.2% blended S&P 500 earnings growth since the same period in 2016.
Earnings grew in every sector except Consumer Discretionary.
More impressive is that companies also expanded their net profit margins.
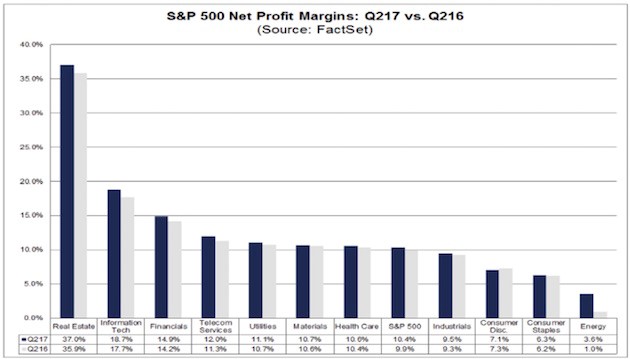
The bars above show net profit margins by sector for the second quarters of 2017 and 2016. The only sector to see compressed margins was Consumer Discretionary, and only by 0.2 percentage points.
Forget for a moment that these are public companies. Imagine it’s your own business.
Not only are you nicely profitable, you are even more profitable on each dollar of revenue (which also grew) than you were a year ago. And that’s after you paid yourself a handsome salary and bonus.
Are you happy? Of course you are. Would you be eager to sell your business to someone else? Maybe, but you would ask a premium price for it. That’s essentially the calculation stockholders are making right now.
Business is good and getting better. No reason to sell at anything less than full price, generously defined.
Reluctant sellers mean higher prices. That’s the foundation of this bull market. The market will likely fall if the foundation erodes, but that hasn’t happened yet.
A Simple Rule for Private Investors
The systems I covered above are rather complex. However, one simple rule of thumb can enable you to benefit from a bull market and avoid the worst of a bear market: When your stock or index goes above the simple 200-day moving average, you are in the market; when it falls below that average, you are out.
I will explain some of the complications and caveats momentarily.
I had my friend Steve Blumenthal send me the following four charts of the Dow, the S&P 500, the NASDAQ, and the Russell 2000.
The first three are all above their 200-day moving average, and the Russell just dipped below its 200-day average. I post the charts so you can see the ebb and flow over time.
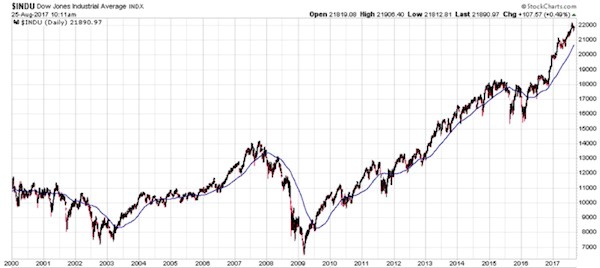
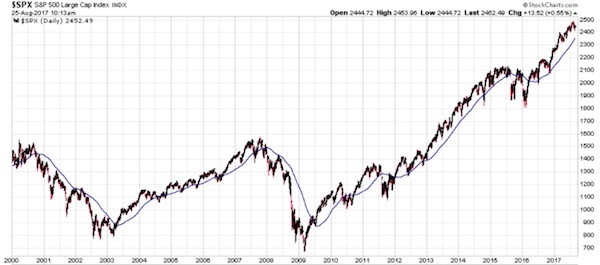
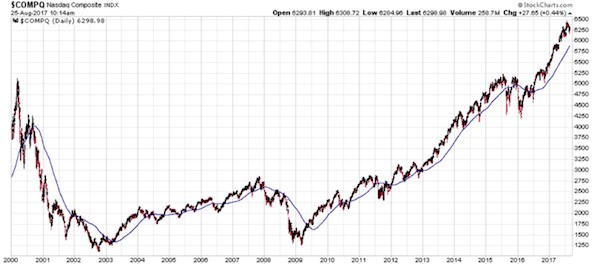
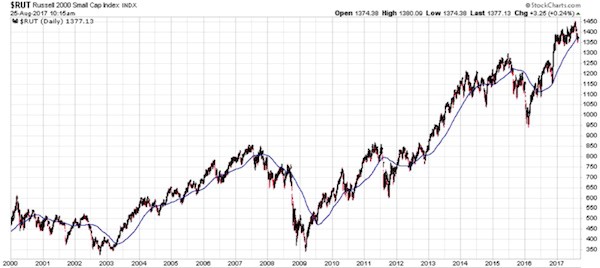
Relying on the 200-day moving average is not the best system, and some traders will note that point approaching and play games to take away some of your potential earnings. But if you don’t have a system, you’ll miss out, and the 200-day moving average works better than no system at all.
There are better rules and moving averages to use, but that’s what my clients pay me for, and I’m giving you this for free. Further tip: Different indexes and stocks and other markets have different relevant moving averages.
Yes, this system has flaws, and so do others. There is no perfect system. If you’re going to trade the markets, you are going to have losing periods. If it were easy, everybody could do it.
But at least you can do the simple stuff to minimize the losses and maximize the gains. I know successful commodity traders who are right only 40% of the time. But they cut their losses quickly, and when they catch a big run it really makes a difference.
But when I tell you to have a system that allows you to hedge your investments, at least do that at a minimum. Do not simply be passively long and forget about it. You will not like the correction that accompanies the next recession—whenever it comes.
Get one of the world’s most widely read investment newsletters… free
Sharp macroeconomic analysis, big market calls, and shrewd predictions are all in a week’s work for visionary thinker and acclaimed financial expert John Mauldin. Since 2001, investors have turned to his Thoughts from the Frontline to be informed about what’s really going on in the economy. Join hundreds of thousands of readers, and get it free in your inbox every week.
John Mauldin Archive |
© 2005-2022 http://www.MarketOracle.co.uk - The Market Oracle is a FREE Daily Financial Markets Analysis & Forecasting online publication.


