


Copper, Oil, Commodities Bottom as Emerging Markets Breakout
Commodities / Commodities Trading Sep 28, 2017 - 12:49 PM GMT

 Tonight I would like to update some of the different commodities and emerging markets we took some positions in back in late July of this year. First, let me say that as investors we like everything to line up in perfect harmony so we can make some sense out of what is actually happening in the markets. It’s just human nature. For example, if the US dollar is doing this then the PM complex or the commodities should be doing that. There is a general rule that there is an inverse correlation between the US dollar and the PM complex or commodities, but it’s not always accurate.
Many times we can get bogged down trying to make everything fit perfectly before we make a trade. This can sometimes lead to missed opportunities as what we were expecting didn’t take place. For the most part this is one of the reasons why I prefer Chartology. When a pattern is building out the bears and bulls are making their side known by the battle they’re having with each other, which eventually creates a consolidation or reversal pattern. All the fundamentals that a stock has is also priced into the chart pattern.
Many times as investors we have to know why a stock is doing what it’s doing, from a fundamental point of view, which can begin to complicate things to the point where we become more confused than ever and can’t see the forest for the trees anymore. For me personally I try to keep it fairly simple by looking at what chart pattern is building out and base my buy or sell points by what the chart is suggesting. Nothing is perfect when it comes to trading the markets, but sometimes less is more.
I know right now many investors are seeing a stronger dollar and expect that commodities will head much lower based on the inverse correlation these two generally have which may in fact turn out that way. From a Chartology perspective many of the different commodities built out very large reversal patterns, which is going to be very hard to reverse those patterns. So regardless of what the US dollar is doing I have to go with what the chart patterns are suggesting.
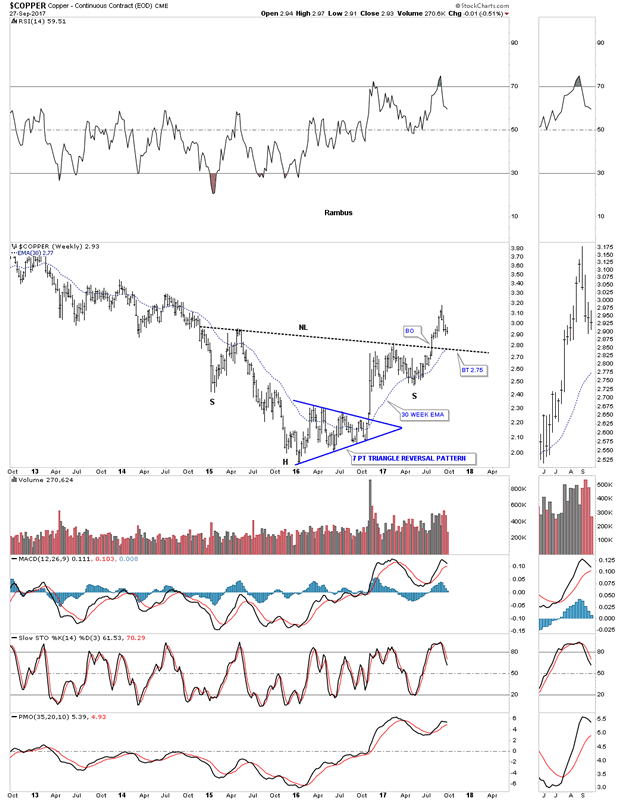
Lets start by looking at a weekly chart for Copper which built out a very large 3 year inverse H&S bottom. About 3 months ago we got the breakout above its neckline telling us the bottoming process was complete. After a strong breakout move Copper is now pulling back to the breakout point forming a backtest to the neckline which will come in around the 2.75 area along with the 30 week ema. Until something changes this bullish setup I have to respect what the chart is saying regardless of what the US dollar is doing presently.
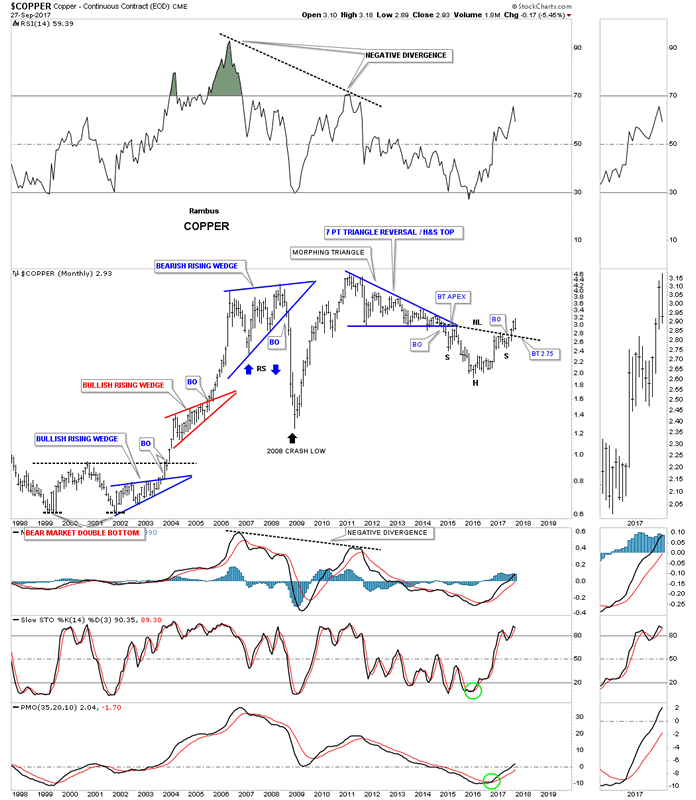
The 20 year monthly chart for Copper shows a very symmetrical H&S bottom forming after an almost 7 year decline. This is the area one would be looking for some type of reversal pattern to form.
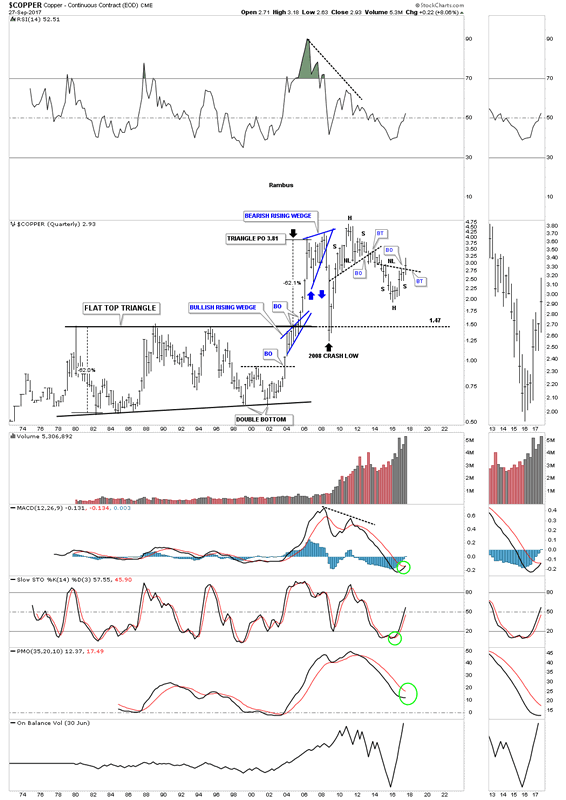
When one looks at this 45 year quarterly chart for Copper you can begin to see how our current H&S bottom fits into the very big picture. Note the beautiful H&S top that formed at the 2010 high. It took approximately 3 quarters for the breaking out and backtesting process to play itself out before the impulse move down began. Before we leave this chart Copper built out a 25 year flat top triangle which led to that strong impulse move up. Also note the blue bullish rising wedge which formed just below the top rail of that 25 year flat top triangle which gave Copper the energy it needed to finally take out that massive resistance line.
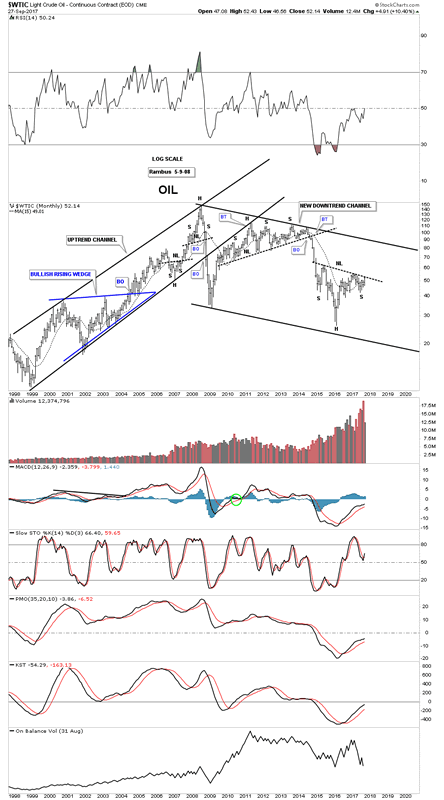
Another very important commodity is Oil, which is building out its own 3 year H&S reversal pattern after an almost 5 year decline. This weekly chart shows the price action is currently testing the neckline. Many times a line chart will give you an early heads up when a breakout is about to take place vs a bar chart.
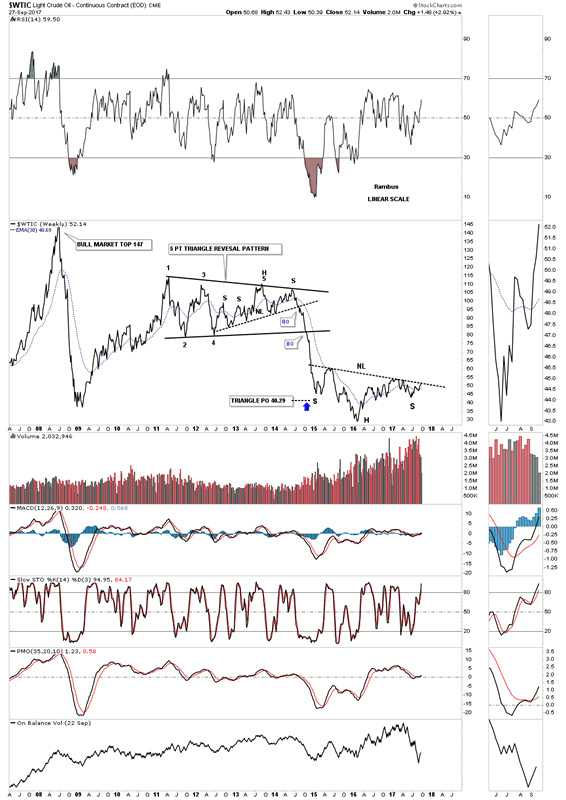
When looking at these H&S bottoms make a mental note of the price objective which is taken from the bottom of the head straight up to the neckline. That distance is then added to the breakout point to get a minimum price objective.
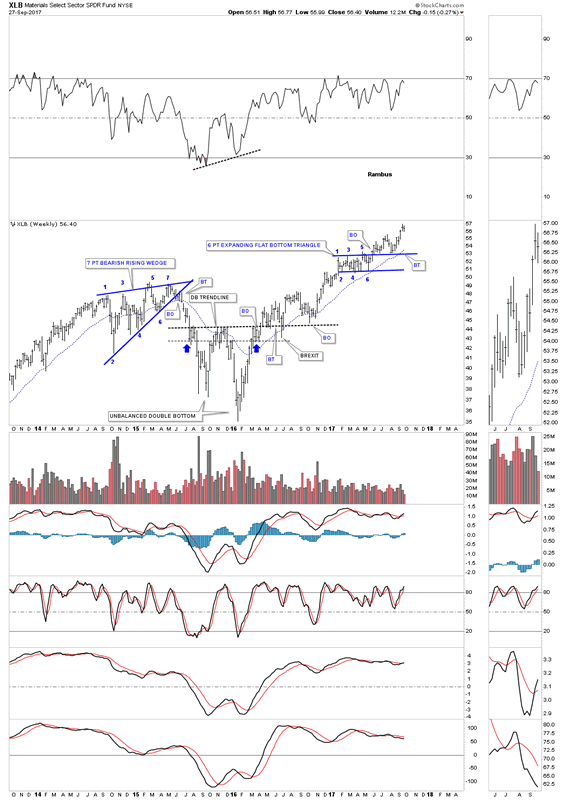
Next lets look at a weekly chart for the XLB, basic materials sector, which is hitting new all time highs.
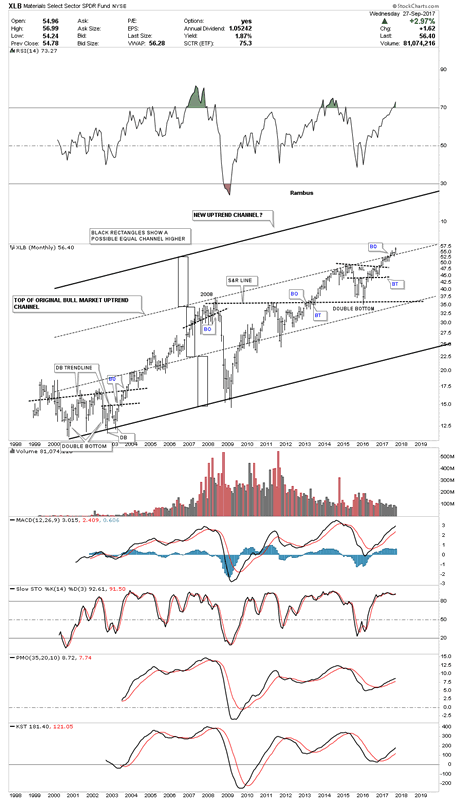
In the past we’ve looked at how the lower channel can morph into a bigger channel that can double in size. In the case for the XLB it looks like a possible 3rd equal channel maybe in the process of building out.
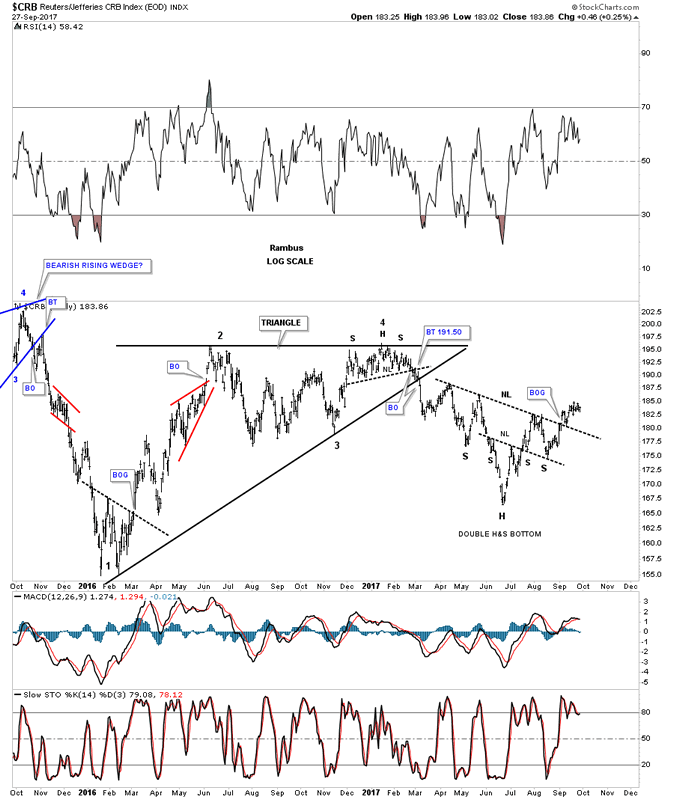
Next lets look at several different commodities indexes to see what they may be telling us. This first commodities index is the old CRB index which has built out a double H&S bottom that experienced a breakout gap above its neckline earlier this month.
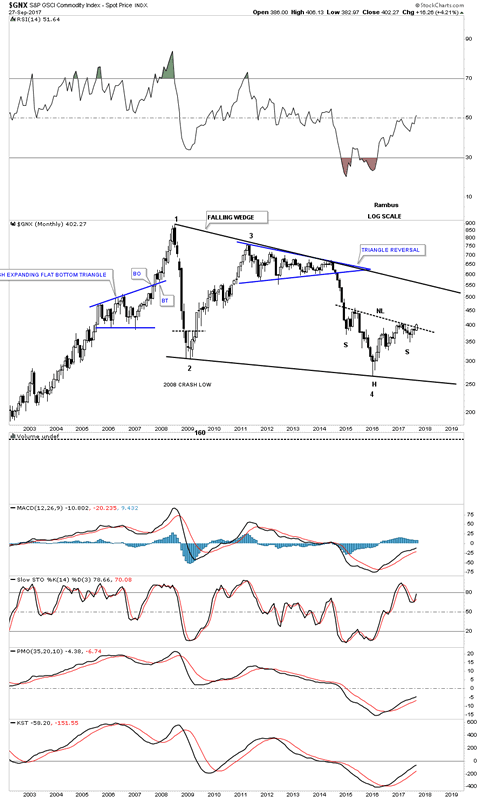
This next commodities index chart is monthly look at the $GNX which is in the process of breaking out above its neckline. Note how this H&S bottom is forming at the 4th reversal point in its 10 year falling wedge.
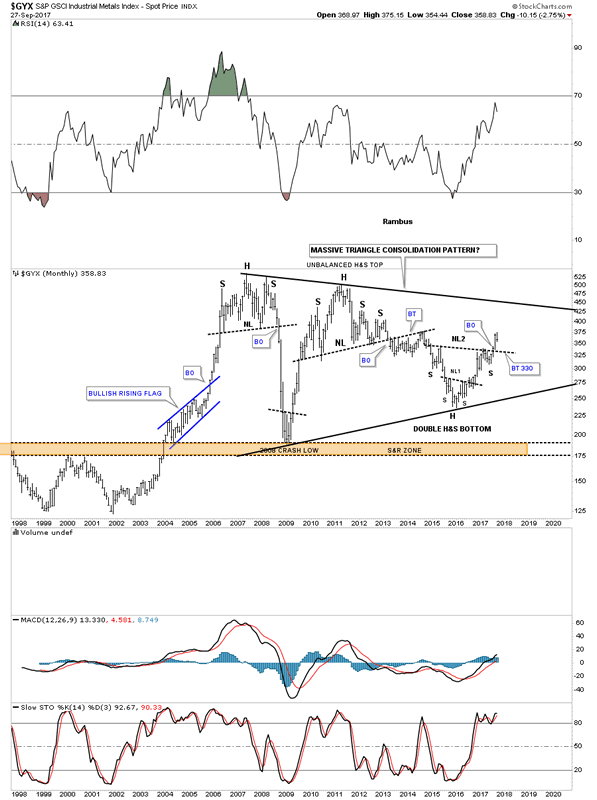
The $GYX, industrial metals index, is building out a double inverse H&S bottom at the 4th reversal point in its 10 year triangle. A backtest to the neckline would come in around the 320 area which should be expected, but not necessary.
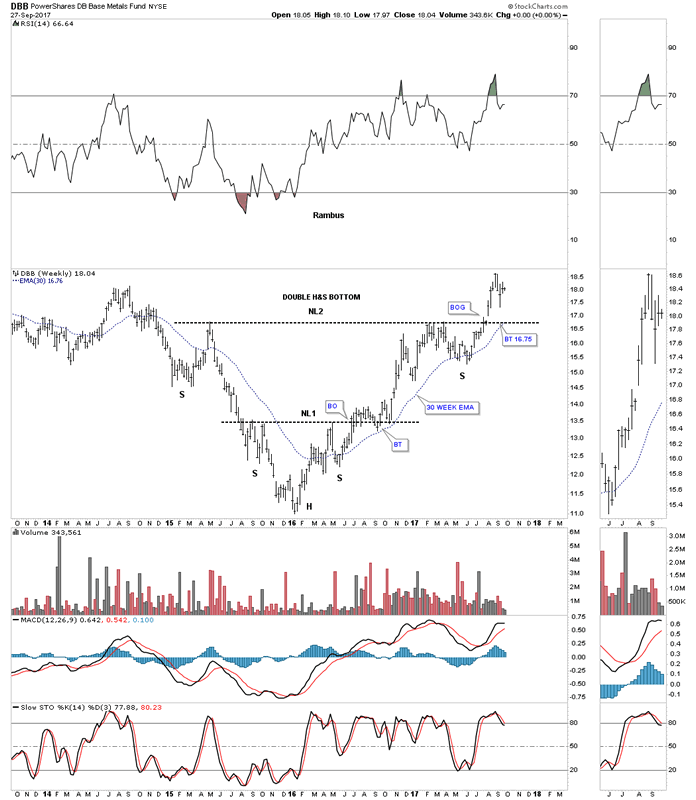
Another base metals index is the DBB which broke out of a double H&S bottom about 8 weeks ago with a breakout gap. A backtest to the neckline would come in around the 16.75 area along with the 30 week ema.
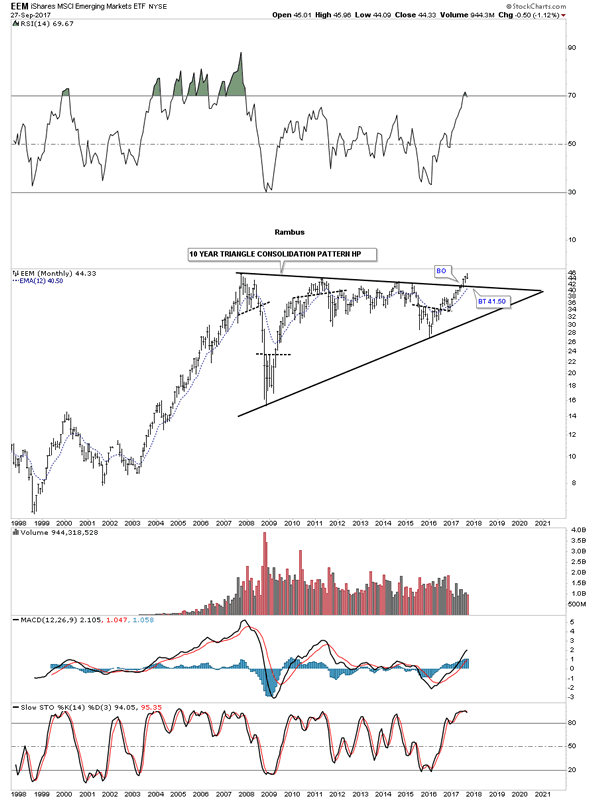
Now lets turn our attention to the emerging markets which is generally affected by the US dollar. The rule of thumb is that when the US dollar is weak it’s good for the emerging markets and vice a versa. Below is a 10 year look at the EEM, emerging market etf, which broke out of a massive 7 year expanding falling wedge. A backtest to the top rail would come in around the 41.85 area along with the 30 week ema.
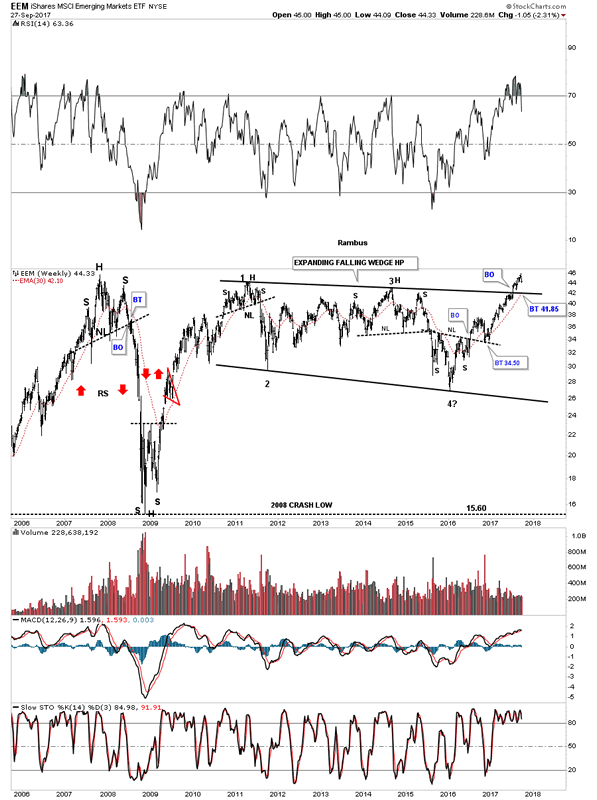
Believe it or not there is an even a bigger chart pattern building out on the EEM which is a 10 year triangle consolidation pattern. As you can see the breakout occurred 3 months ago with the possible backtest to the top rail in progress.
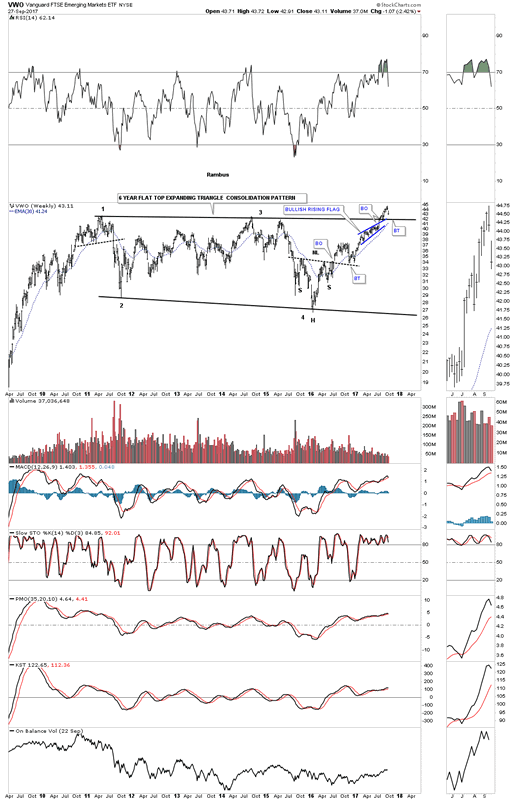
There is another emerging market etf I follow which is the VWO that broke out from its 6 year flat top expanding triangle and is now in the process of backtesting the top rail. Note how the blue bullish rising wedge formed just below the to rail just before the breakout. Classic Chartology.
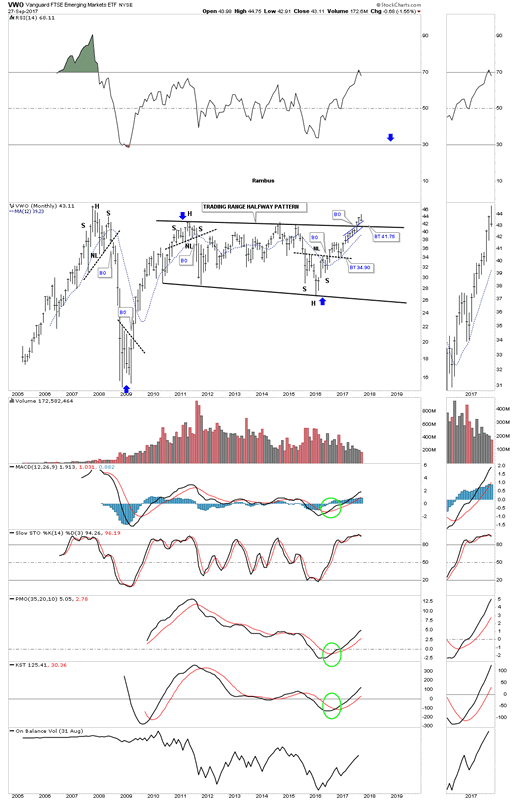
This monthly chart shows a complete backtest would come in around the 41.75 area.
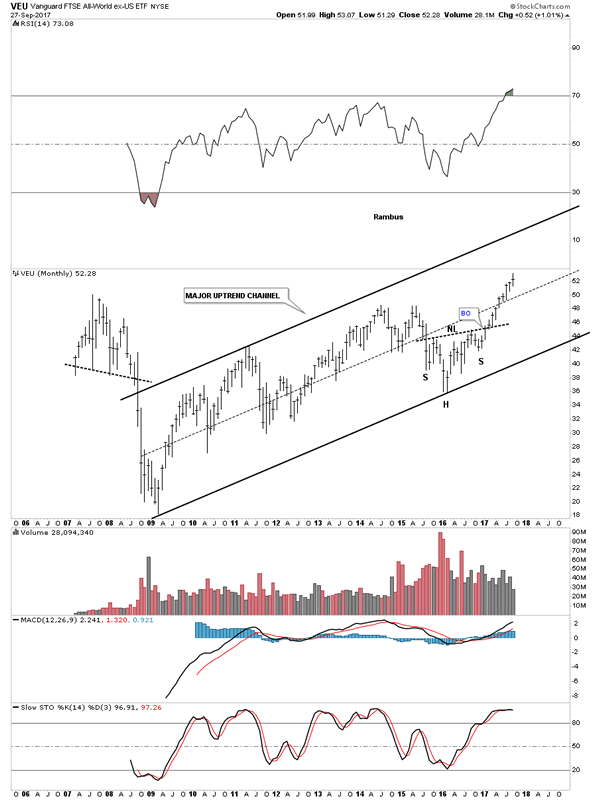
This last chart for tonight is a 10 year monthly look at the VEU which is an all world etf minus the US stock market. This chart gives you a good idea of how the rest of the world is doing, which looks very bullish as this index is making new all time highs within its 2009 bull market uptrend channel.
When looking at many of these commodity charts above you can see many H&S bottoms playing out on a large scale. Think of all the shares that had to trade by millions of investors to build out these reversal patterns. Regardless of what the US dollar is going to do these huge bottoms are going to be very difficult to change into something bearish. Trying to figure it all out from a fundamental point of view will be harder still. The patterns are there and until something changes these pattern, they are what they are. All the best…Rambus
All the best
Gary (for Rambus Chartology)
FREE TRIAL - http://rambus1.com/?page_id=10
© 2017 Copyright Rambus- All Rights Reserved
Disclaimer: The above is a matter of opinion provided for general information purposes only and is not intended as investment advice. Information and analysis above are derived from sources and utilising methods believed to be reliable, but we cannot accept responsibility for any losses you may incur as a result of this analysis. Individuals should consult with their personal financial advisors.
© 2005-2022 http://www.MarketOracle.co.uk - The Market Oracle is a FREE Daily Financial Markets Analysis & Forecasting online publication.