


GBPUSD Failed To Break Above Long Term Bearish Trend Line
Currencies / British Pound Oct 03, 2017 - 04:10 PM GMTBy: Franco_Shao

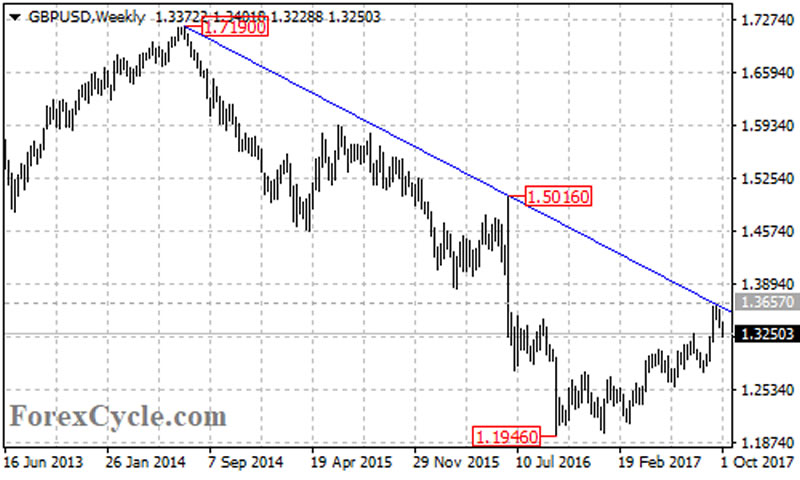
 GBPUSD failed in its attempt to breakout of the long term resistance trend line from 1.7190 to 1.5016 on the weekly chart and pulled back from 1.3657, suggesting that a short term top had been formed.
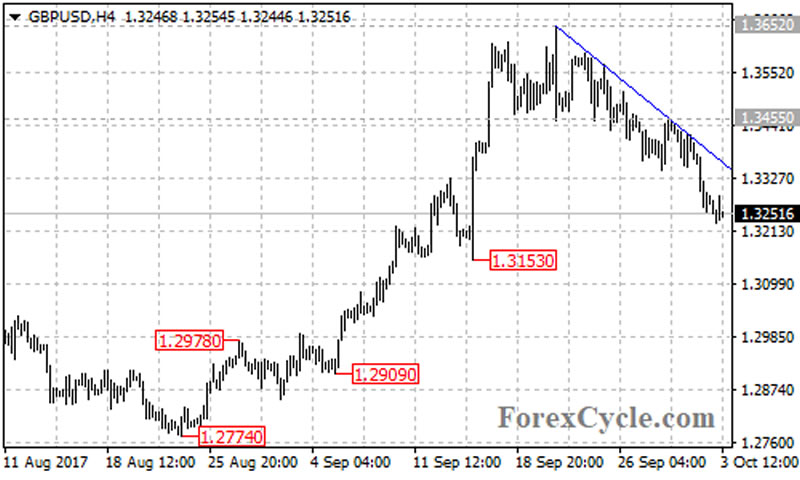
On the 4-hour chart, the GBPUSD pair stays below a bearish trend line with resistance at around 1.3360. As long as the price is below the trend line, the downside movement from 1.3652 could be expected to continue and next target would be at 1.3153.
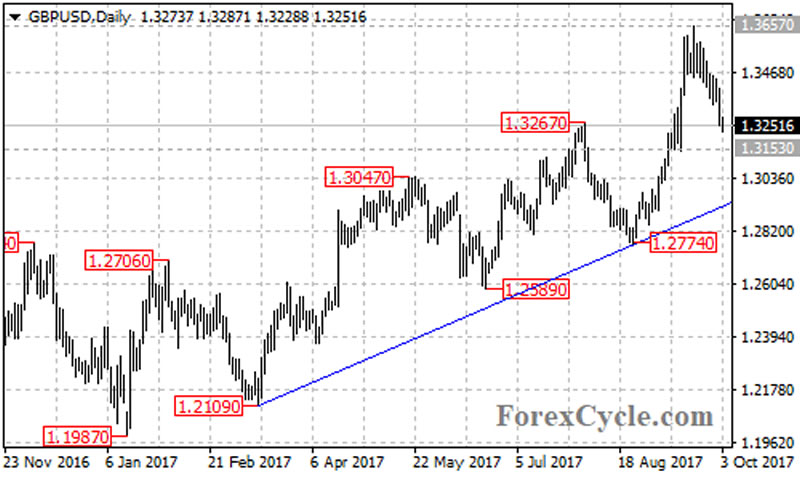
Below 1.3153 support could take price towards a bullish trend line on the daily chart, now at around 1.2930. This trend line acts as a key support for the uptrend from 1.1946. A break through this trend line would indicate that the uptrend had completed at 1.3657 already, then the following downside movement could take price towards 1.1946 previous low.
On the other side, a clear break above the trend line on the 4-hour chart could signal completion of the short term downtrend from 1.3657, then further rally to test 1.3455 resistance could be seen. Move through here if seen could trigger further upside movement to retest the long term bearish trend line on the weekly chart. Above this trend line would target next resistance level at the 38.2% Fibonacci retracement taken from 1.7190 to 1.1946 at 1.3950. This level would be the final target of the whole upside move from 1.1946.
For long term analysis, the bounce from 1.1946 is likely correction of the long term downtrend from 1.7190. A clear break below the trend line on the daily chart could suggest that the correction is complete, then another fall towards 1.1000 could be seen.
Technical levels
Support levels: 1.3153 (the September 14 low), 1.2930 (the bullish trend line on the daily chart), 1.2774 (the August 24 low), 1.2109 (the March 14 low), 1.1946 (the October 2016 low).
Resistance levels: 1.3360 (the bearish trend line on the 4-hour chart), 1.3455 (the September 28 high), 1.3657 (the major resistance trend line on the weekly chart), 1.3950 (the 38.2% Fibonacci retracement).
This article is written by Franco Shao, a senior analyst at ForexCycle.
© 2017 Copyright Franco Shao - All Rights Reserved Disclaimer: The above is a matter of opinion provided for general information purposes only and is not intended as investment advice. Information and analysis above are derived from sources and utilising methods believed to be reliable, but we cannot accept responsibility for any losses you may incur as a result of this analysis. Individuals should consult with their personal financial advisors.
© 2005-2022 http://www.MarketOracle.co.uk - The Market Oracle is a FREE Daily Financial Markets Analysis & Forecasting online publication.