U.S. Mint Gold Coin Sales and VIX Point To Increased Market Volatility and Higher Gold
Commodities / Gold and Silver 2017 Oct 14, 2017 - 02:25 PM GMTBy: GoldCore
 – US Mint gold coin sales and VIX at weakest in a decade
– Very low gold coin sales and VIX signal volatility coming
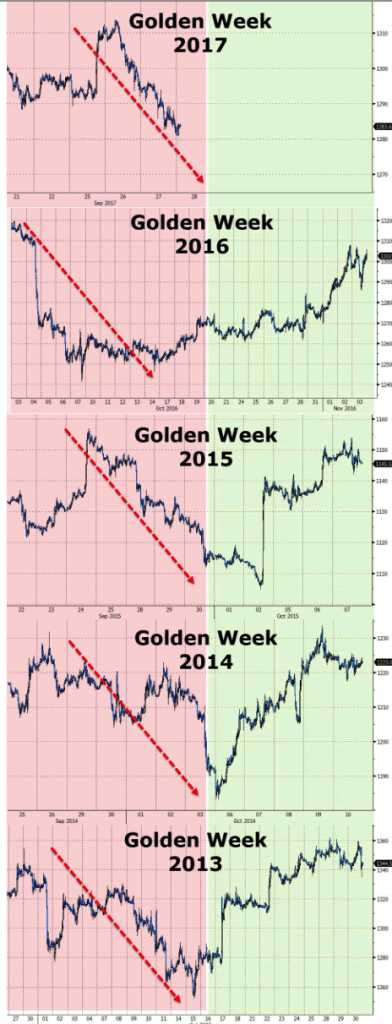
– Gold rises 1.7% this week after China’s Golden Week; pattern of higher prices after Golden Week
– U.S. Mint sales do not provide the full picture of robust global gold demand
– Perth Mint gold sales double in September reflecting increased gold demand in both Asia and Europe
– Middle East demand likely high given geopolitical risks
– Iran seeing increased gold demand and Iran’s gold coin price up by 5%
– Trump’s war mongering could see demand accelerate
– Germany seeing very robust demand and now world’s largest gold buyer
Editor: Mark O’Byrne
Source: ZeroHedge
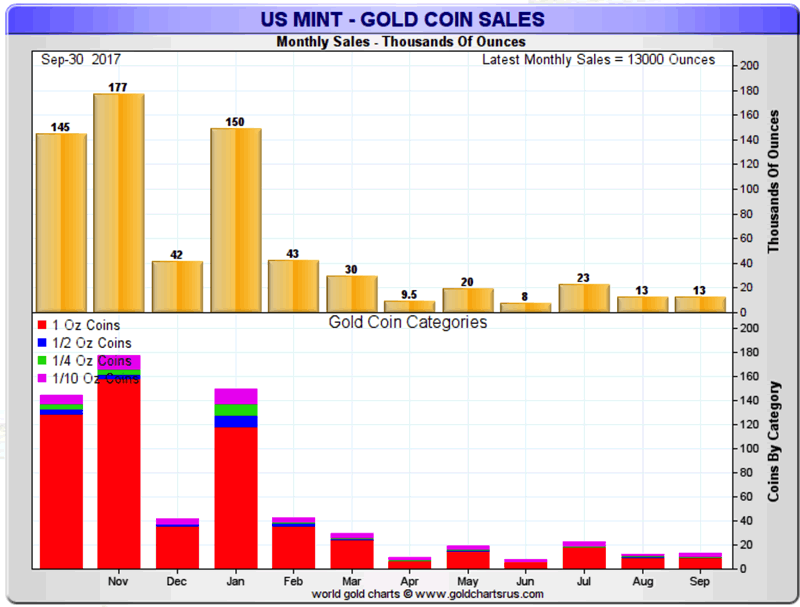
US Mint coin sales fell to a decade low last month. This follows poor sales since the beginning of 2017. In the third quarter sales reached nearly 3.7 million ounces. September gold coin sales were down a whopping 88% compared to the same period last year.
Year to date sales at 232,000 ounces are 66.5% lower than the 692,500 ounces delivered during the first nine months of 2016, according to the U.S. Mint.
American Eagle gold coin sales did see a slight uptick in demand from very low levels and increased by 11,500 ounces in September which was up by 21.1% in August.
Is this pick-up in US coin demand a sign of things turning around? Perhaps, but we believe the low coin sales this year might say something else about the wider economy. It is also important to look at gold coin and bar sales across the globe to get a better feel for actual demand.
Sign of the end, but for what?
Bloomberg were quick to point out that US Mint sales were at a decade low.
They believed this was due to investors turning ‘sour on bullion’ and that gold’s appeal ‘is waning as retail investors seek better returns in equities, lured by the S&P 500 Index’s climb to records.’
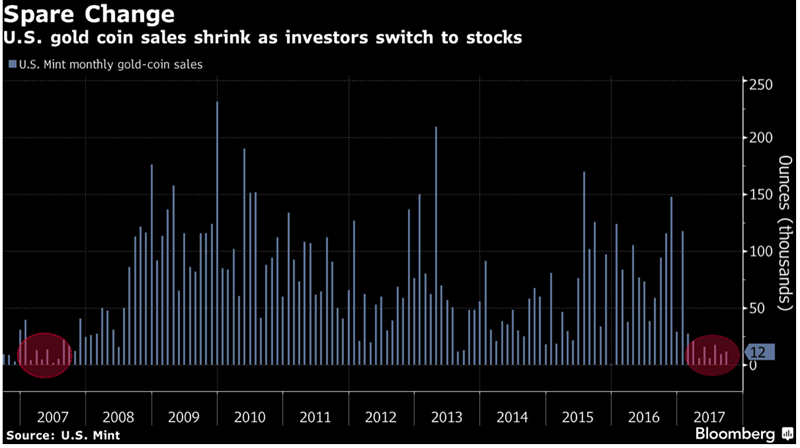
However, the picture of declining gold coin sales has not been taken against the backdrop of the last decade.
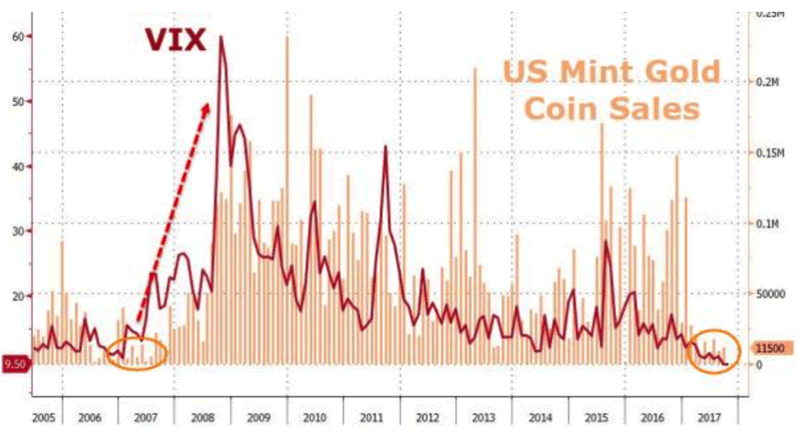
ZeroHedge were quick to spot a potential pattern and correlation with the VIX which may point to increased volatility and uncertainty and a prompt recovery in the gold price:
“The first nine months of 2017 have seen demand for gold coins slump. As stocks soar unendingly (and vol drops unerringly) the US Mint notes that sales of coins is at its weakest in a decade as complacency in the face of ever-increasing potential-crisis-events nears record highs.
The question is – what happened the last time the public gave up on buying “protection against the idiocy of the political cycle”?
The answer is awkwardly simple… everything collapsed.”
This is important news for those who are getting wary about the massive complacency and “irrational exuberance” currently seen in global stock and bond markets.
It’s not all about the U.S. Mint gold coin demand
Given how much Trump dominates the headlines it might be hard to remember that U.S. demand is not a reflection of total gold demand.
Whilst the U.S. Mint poor gold coin continued in September, their cousins ‘down under’ recorded excellent sales in September.
On Monday we covered how Perth Mint gold coins sales doubled in September. Last month the Perth Mint sold 46,415 ounces of gold in bars and coins. In August, its gold bullion sales were just 23,130 ounces. Silver product sales soared by 78 percent from the previous month.
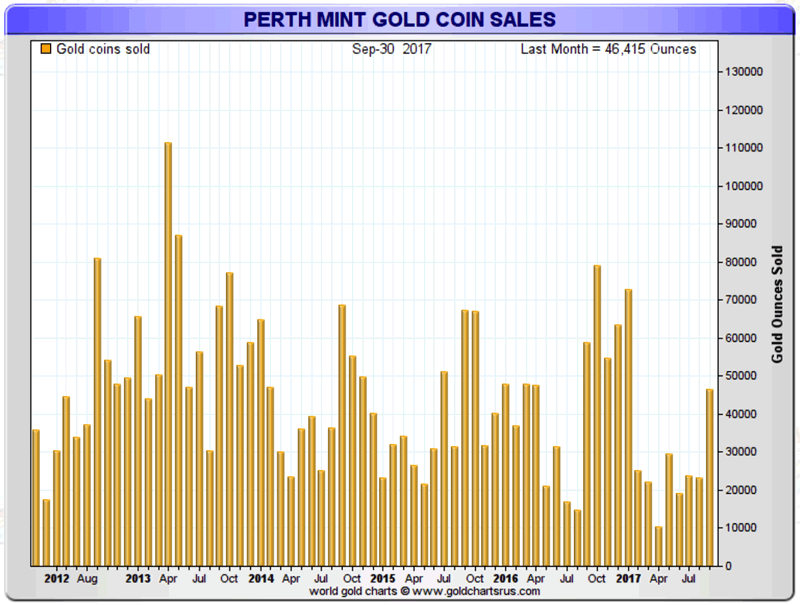
Why is this relevant? The Perth Mint sells gold all over the world. The US Mint predominantly sells domestically and would be more dependent on domestic demand.
The Australian Mint’s sales figures are a better reflection of the robust demand in the likes of Asia and Europe, where investors are growing increasingly risk aware.
Data released by the World Gold Council last week showed Germany is now the world’s largest buyers of gold. We explained:
Last year, more than €6bn was ploughed into gold investment products in Germany and, encouragingly, there is room for further growth: consumer research indicates there is latent retail demand which the industry can tap into.
We have long said that German physical and ETF gold demand is a very important demand factor in the gold market and one that is continuously underestimated. It was good to have the WGC research bolster our view.
No way of knowing real levels of demand
In the short-term we need to remind ourselves that these are only official figures for two mints.
When we reported on the 11% increase in gold bar and coin demand for the first half of 2017, we reminded readers that there are likely other sources of demand that are not recorded. We said that it is
“Important to note this is all official, transparent and recorded demand. There is demand and flows of gold that cannot be and are not recorded – especially into the Middle East, India, Russia and of course China.”
Each week there are stories of gold smugglers caught in airports, but this is just the tip of the iceberg. At a much higher level we know that the likes of Russia and China are working together to fight US dollar hegemony, with the help of gold.
The Government of India Ministry Of Commerce and Industry reported this month that $1.9 billion worth of gold was imported to the county in August. In the same month last year, it was more than $1.1 billion worth of gold
We also see record numbers of gold imports and exchange activity in the Middle East, especially in Dubai.
Last month the Central Bank of Iran cut interest rates. Since then the gold price has surged, setting a new five-year record. The price of a gold coin in Iran, according to the Tehran Gold and Jewelry Union, has climbed by 5% in the last month.
What about China? The mainstream have also been quick to point to weak sales despite China’s Golden Week. This is also missing the bigger picture, argues ZeroHedge.
“China will be back in business on October 9th, and that means the Shanghai Gold Exchange, which opened in 2015 to counter Western manipulation of precious metals, will likely help re-balance prices to where they were before this recent takedown.
We could be wrong, but something tells us gold and silver prices won’t stay this low for much longer and that they could well see a complete turnaround when China reopens on October 9th.”
China’s Golden Week might even point to a quick recovery and the gold price coming back stronger than before, if earlier years are anything to go by:
Complacency dominates
Currently the mood of markets is thick with complacency. Risk is significantly under priced and underestimated.
It is tough to reconcile the risks we see currently and on the horizon against the backdrop of record stock market prices. Complacency may well have seeped into the market for the US Mint’s coins.
However, it is clear market volatility is coming. It looks like central bankers and governments won’t be able to forestall the inevitable for much longer.
Some in the mainstream media are, as ever, keen to point to ‘disaster’ in the gold market.
At worst, the US Mint figures are a small snapshot of complacency in a world which is otherwise focused on stocking up on gold. At best they are an indication that markets are due to have another roller coaster ride of uncertainty and volatility making the case for hedging with gold even more compelling.
Investors should be taking advantage of the valuable time in this the ‘calm before the storm’ and the low gold price. In Europe and Asia it is the imminent feeling of uncertainty and growing instability which is driving buyers to allocate more to gold. This might not be felt just yet in the United States, but lots of indications suggest it soon will be.
As ever, best to hope for the best but be financially prepared for less benign scenarios …
Gold Prices (LBMA AM)
13 Oct: USD 1,293.90, GBP 972.88 & EUR 1,093.73 per ounce
12 Oct: USD 1,294.45, GBP 977.96 & EUR 1,092.26 per ounce
11 Oct: USD 1,290.20, GBP 978.62 & EUR 1,091.90 per ounce
10 Oct: USD 1,289.60, GBP 977.77 & EUR 1,094.61 per ounce
09 Oct: USD 1,282.15, GBP 976.23 & EUR 1,092.01 per ounce
06 Oct: USD 1,268.20, GBP 970.43 & EUR 1,083.93 per ounce
05 Oct: USD 1,278.40, GBP 969.28 & EUR 1,086.51 per ounce
Silver Prices (LBMA)
13 Oct: USD 17.20, GBP 12.94 & EUR 14.55 per ounce
12 Oct: USD 17.20, GBP 13.06 & EUR 14.50 per ounce
11 Oct: USD 17.15, GBP 13.00 & EUR 14.51 per ounce
10 Oct: USD 17.12, GBP 12.98 & EUR 14.53 per ounce
09 Oct: USD 16.92, GBP 12.86 & EUR 14.41 per ounce
06 Oct: USD 16.63, GBP 12.73 & EUR 14.20 per ounce
05 Oct: USD 16.66, GBP 12.64 & EUR 14.19 per ounce
Mark O'Byrne
This update can be found on the GoldCore blog here.
IRL |
UK |
IRL +353 (0)1 632 5010 |
WINNERS MoneyMate and Investor Magazine Financial Analysts 2006
Disclaimer: The information in this document has been obtained from sources, which we believe to be reliable. We cannot guarantee its accuracy or completeness. It does not constitute a solicitation for the purchase or sale of any investment. Any person acting on the information containd in this document does so at their own risk. Recommendations in this document may not be suitable for all investors. Individual circumstances should be considered before a decision to invest is taken. Investors should note the following: Past experience is not necessarily a guide to future performance. The value of investments may fall or rise against investors' interests. Income levels from investments may fluctuate. Changes in exchange rates may have an adverse effect on the value of, or income from, investments denominated in foreign currencies. GoldCore Limited, trading as GoldCore is a Multi-Agency Intermediary regulated by the Irish Financial Regulator.
GoldCore is committed to complying with the requirements of the Data Protection Act. This means that in the provision of our services, appropriate personal information is processed and kept securely. It also means that we will never sell your details to a third party. The information you provide will remain confidential and may be used for the provision of related services. Such information may be disclosed in confidence to agents or service providers, regulatory bodies and group companies. You have the right to ask for a copy of certain information held by us in our records in return for payment of a small fee. You also have the right to require us to correct any inaccuracies in your information. The details you are being asked to supply may be used to provide you with information about other products and services either from GoldCore or other group companies or to provide services which any member of the group has arranged for you with a third party. If you do not wish to receive such contact, please write to the Marketing Manager GoldCore, 63 Fitzwilliam Square, Dublin 2 marking the envelope 'data protection'
GoldCore Archive |
© 2005-2022 http://www.MarketOracle.co.uk - The Market Oracle is a FREE Daily Financial Markets Analysis & Forecasting online publication.


