


10 Years Ago Today a Stocks Bear Market Started
Stock-Markets / Stock Market 2017 Oct 19, 2017 - 11:25 AM GMTBy: Chris_Vermeulen

 Yes, much has recently been published about the 10-year anniversary of the 2007~08 credit market crash and many people are trying to make comparisons between then and now. Some of this information is valid and factual. For example, the amount of debt now is much higher than the debt levels in 2004~08. This would lead some to consider the scope of any global debt related issues to be much larger and more dangerous than in 2007. Additionally, the types of levels of debt have begun to froth back into the dangerous and risky derivatives markets, ARMs and MBSs. Although, we keep hearing, “this time it’s different”.
Last week ActiveTradingPartners.com published a research document that illustrated some of our newest modeling tools. The consensus analysis was that the bullish trend should continue for a while still, yet it will likely be more moderate in nature. Price volatility should continue to expand over the next few weeks as price rotation becomes more evident. There is a potential near October 12th and October 30th for a volatility spike to happen in the markets. This, most likely, would result in a moderately deep price correction or rollover. Overall, we remain cautiously bullish for the US majors and continue to be wary of weakness that may creep into the markets. In other words, we continue to believe the markets will continue to attempt to push higher for a few more weeks at least – yet we are very cautious of any potential weakness or extended volatility because we believe this market could turn on a dime.
There are a number of factors that are starting to affect the markets going forward. Two of the most critical are uncertainty with regards to geo-politicial events and leadership and the other is the global central banks. Right now, it appears everyone is living high on the debt cycles that have been perpetuated over the past 8+ years as well as the run in asset valuations (homes, land, equities and others). This run has created a scenario where many people, many of them the under 40yo millennials, have leveraged themselves quite extensively with student loans, auto loans, home loans, credit card and other revolving debt. These are, in our opinion, the segment of the consumer market that will be the early warning signs for any new crisis.
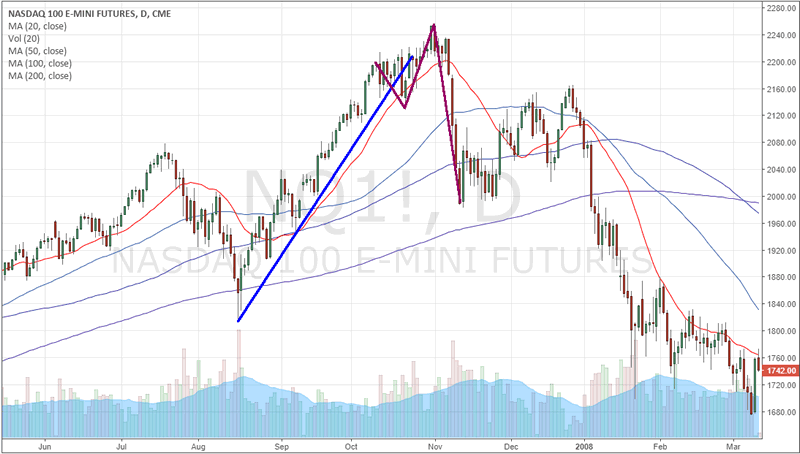
Rather than go into detail regarding debt levels and delinquencies that are stacking up all over the globe, we will focus on the most simple concept for investors to identify – the failed top rotation of 2007 and how it will likely relate to current price activity.
The failed top rotation in 2007 formed after an extended run higher and as volatility began to increase dramatically. We believe a similar type of top formation will likely form in the US markets should any new rotational trend reversal form over the next few weeks/months. This also falls in line with our “moderate bullish trend – yet cautious” analysis of the current trend. Take a look at this chart of the NASDAQ in 2007-08 and pay attention to the price rotation that occurred over 4~6 months before the crisis event really began to unfold.
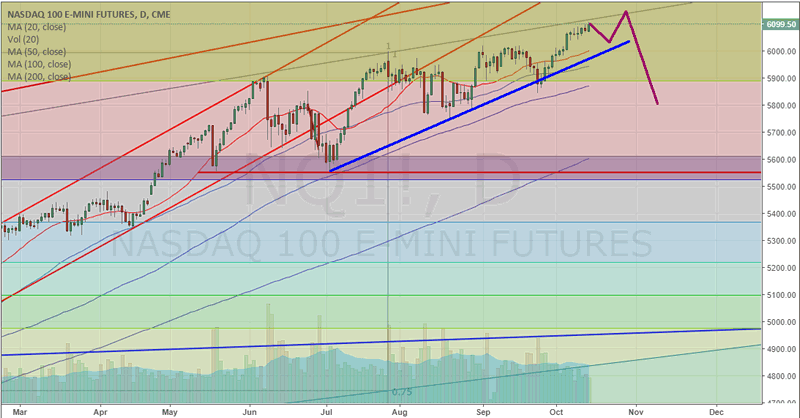
In comparison, take a look at the most recent NQ data for 2017. The length of the moves on the current chart are extended (span a greater amount of time), yet the moves are very similar. The double-bottom formation in early 2017 is unique and identifies key support near 5550. Any similar failed top formation would begin with increased price volatility, resulting in a VIX Spike, as well as the expanded price congestion that is associated with higher volume repositioning in the markets. Notice that in 2007, the volume suddenly spiked higher near the middle of October as the volatility expanded. We would expect to see the same thing happen currently if this failed top pattern unfolds again.
As many of you are aware, it is impossible to accurately time and predict major tops/bottoms in the markets. The best we can hope for is to be aware of potential events before they happen and to be prepared. That is why we dedicate our research to delivering timely and accurate data to all ActiveTradingPartners.com members as well as delivering accurate trading signals and daily market commentary. ActiveTradingPartners.com is our premier solution for active traders who want to take advantage of timely and accurate market signals and turning points. Please take a moment to review our services for active traders.
In closing, we wanted to highlight one of the most concerning setups we can use to illustrate the potential for future volatility and price rotation in the US majors (and possibly global markets). The Metals markets are a key element in protecting against fear, inflation or deflation as well as major market collapse. When the metals markets are moving higher, there is typically a measured amount of fear or concern that is entering the markets. These types of moves can often be signs to investors that volatility or underlying events could be at play as smart money moves into long metals positions.
Our analysis of the Metals markets shows we are setting up for a Wave 5 move higher which we believe could be a very dramatic move.

If you would like to know what ATP is all about and if you like this type of market analysis/research, then visit our web site today to learn how we help active traders understand the markets, actively trade and generate profits. The markets won’t wait for you to decide when to protect your positions. Isn’t it time you invested in your future success with www.ActiveTradingPartners.com
Chris Vermeulen
www.TheGoldAndOilGuy.com – Daily Market Forecast Video & ETFs
www.ActiveTradingPartners.com – Stock & 3x ETFs
Chris Vermeulen is Founder of the popular trading site TheGoldAndOilGuy.com. There he shares his highly successful, low-risk trading method. For 7 years Chris has been a leader in teaching others to skillfully trade in gold, oil, and silver in both bull and bear markets. Subscribers to his service depend on Chris' uniquely consistent investment opportunities that carry exceptionally low risk and high return.
Disclaimer: Nothing in this report should be construed as a solicitation to buy or sell any securities mentioned. Technical Traders Ltd., its owners and the author of this report are not registered broker-dealers or financial advisors. Before investing in any securities, you should consult with your financial advisor and a registered broker-dealer. Never make an investment based solely on what you read in an online or printed report, including this report, especially if the investment involves a small, thinly-traded company that isn’t well known. Technical Traders Ltd. and the author of this report has been paid by Cardiff Energy Corp. In addition, the author owns shares of Cardiff Energy Corp. and would also benefit from volume and price appreciation of its stock. The information provided here within should not be construed as a financial analysis but rather as an advertisement. The author’s views and opinions regarding the companies featured in reports are his own views and are based on information that he has researched independently and has received, which the author assumes to be reliable. Technical Traders Ltd. and the author of this report do not guarantee the accuracy, completeness, or usefulness of any content of this report, nor its fitness for any particular purpose. Lastly, the author does not guarantee that any of the companies mentioned in the reports will perform as expected, and any comparisons made to other companies may not be valid or come into effect.
Chris Vermeulen Archive |
© 2005-2022 http://www.MarketOracle.co.uk - The Market Oracle is a FREE Daily Financial Markets Analysis & Forecasting online publication.