Here’s Why Stocks and Home Runs Are at All-Time Highs
Stock-Markets / Stock Market 2017 Oct 27, 2017 - 12:22 PM GMTBy: EWI
 By Alan Hall, senior analyst at the Socionomics Institute
This article was originally published on CNBC under the headline "Home Runs and Strikeouts Can Track the Stock Market."
________________________________________
Why in the world would Major League Baseball home run statistics track the U.S. stock market?
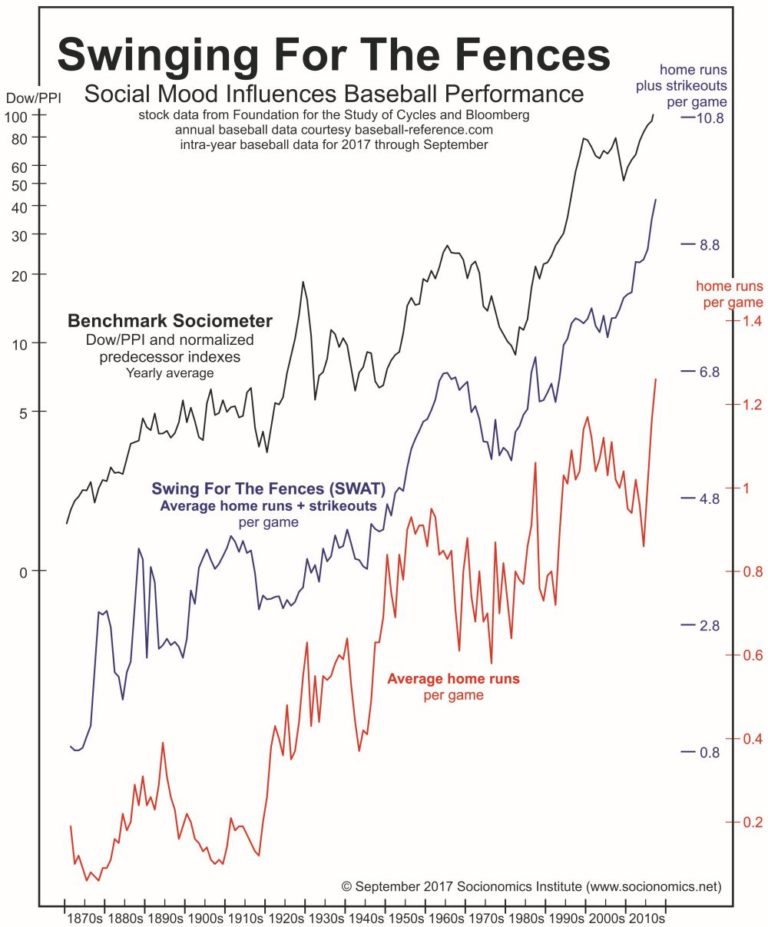
It's tempting to dismiss such a finding as a wild coincidence or a fluke, but as you can see in the chart, the relationship between the two has persisted for nearly 150 years. What's more, it gets even stronger if you add strikeouts into the mix. Most hitters and pitchers don't check stock tickers before swinging and flinging, and most stock investors don't check baseball stats before buying and selling. So what's the connection? The simplest explanation is that society's overall mood influences performance in both arenas.
For example, on Friday, June 2 of this year, the Dow Jones Industrial Average set a new all-time high for the first time in three months. The next day, confidence wafted on the breeze, along with the aromas of hot dogs and popcorn, as Seattle Mariners catcher Mike Zunino stepped up to the plate and gracefully swatted a "mammoth" grand slam. Zunino later told the Associated Press: "It's just nice to step in the box and feel like you can hit."

Feeling "like you can hit" was "l'esprit du jour" in ballparks that Saturday. Six other MLB players also belted grand slams. Zunino's was the seventh, a new single-day record. "It's officially the grandest day in Major League Baseball history," wrote MLB.com.
That record-setting Saturday was part of a record-setting month in a record-setting year for Major League Baseball, mirroring the Dow Jones Industrial Average's record-setting streak to numerous all-time highs. In June, players hit more home runs than in any previous month in history. And on September 19, hitters broke the record for home runs hit in a single season.
The previous single-day grand slam and single-month home run records were set in May 2000, the year of the previous record high for single-season home runs -- and a year in which the stock market also set an all-time high.
Home runs weren't the only records set in baseball this year. Pitchers also threw more "immaculate innings" (striking out a side on nine consecutive pitches) than ever before. The New Yorker wrote, "it's true that the increased tendency to swing for home runs comes with an additional likelihood that one will miss: Strikeouts have also spiked to record rates."
Our chart plots 147 years of social mood as reflected by a PPI-adjusted index of U.S. stocks versus two indicators of baseball performance. The bottom line plots average home runs per MLB game. Homers have trended roughly parallel to the Dow/PPI, but the relationship is not perfect. Notable divergences surround some of the major peaks and troughs.
The middle line in the chart plots average home runs plus strikeouts per game, a new baseball metric which I dubbed the "Swing for the Fences" indicator, or SWAT -- not an exact acronym, but it's catchy and close enough. This performance index has had an even tighter relationship with the Dow/PPI, especially since the 1940s. Today, stocks, SWAT and average home runs per game are at new all-time highs.
Just as the fever for investing peaks and subsides, so do fans' attitudes toward baseball. Sports Illustrated and others have recently argued that the current deluge of home runs and strikeouts is a problem because it makes for a longer, boring game. One can almost hear the passion fading and the psychology shifting.
Robert Prechter's socionomic theory sees stock market indexes as more than just financial indicators. They are also indicators of changes in society's optimism and pessimism, our social mood. Positive mood produces optimism, confidence and stock market advances. Negative mood produces pessimism, fear and stock market declines. The same seems to be true for baseball performance.
Sabermetrics has come a long way in the past four decades, but stats that measure batter confidence and psychology have remained elusive. Perhaps part of the answer has been right under our noses, in the ups and downs of the stock market.
You Can Get Ahead of Fast-Moving News withThe Thinking Person's MembershipImagine scrolling through the latest news stories, nodding and saying, "THAT makes sense." And "THAT is right on time." That is what Socionomics Members get every month. The same events that disrupt most people are confirmation to them. You can join them. |
This article was originally published on CNBC under the headline Home Runs and Strikeouts Can Track the Stock Market.
© 2005-2022 http://www.MarketOracle.co.uk - The Market Oracle is a FREE Daily Financial Markets Analysis & Forecasting online publication.


