


Hurricane Storms Impact on Crude Oil Price
Commodities / Crude Oil Sep 01, 2008 - 02:14 AM GMTBy: Clif_Droke

 Since January we’ve discussed the influence that the 6-year cycle would have over the year 2008. Already we’ve seen many tokens of its impact, primarily in the financial markets. The late banking crisis and subsequent spillover into other areas of the market have been one of the most prominent features of this year.
One of the main reasons why financial markets have been so volatile and subject to so many cross currents this year is because the 6-year cycle is bottoming while its double cycles, the Kress 12-year cycle, is peaking. The last time the 12-year cycle bottomed was in late September/early October 2002 and its effects on the stock market are well known. It produced the end to the previous bear market that year and marked the birth of a new bull market.
This year the 6-year cycle is scheduled to bottom in late September/early October while the 12-year cycle peaks. A little known corollary to this cyclical occurrence, which happens every 12 years, is that the 6-year bottom/12-year peak is normally accompanied by an unusually active hurricane season in the U.S. This in turn can have an impact on the price of storm-sensitive commodities, namely crude oil, as well as even the stock market. In this article we’ll examine the historical record and see how it might be applicable to the month ahead.
Prior to 2008, the years in which the 6-year cycle bottomed simultaneously with the 12-year cycle peak were: 1996, 1984, 1972, 1960, 1948, 1936, 1924 and 1912. Among the hurricane-related highlights of the 6-year bottom/12-year peak:
The 1996 Atlantic hurricane season saw nine hurricanes develop, six of which became major storms. By far the biggest hurricane of the ’96 season was Hurricane Fran, which caused $3.2 billion in damage to North Carolina and caused 26 deaths.

Among the major storms of the 1984 hurricane season was a Category 4 hurricane, Diana, which did $65.5 million in damage in North Carolina and was the first major hurricane to strike the East Coast in nearly 20 years, according to Wikipedia.
The 1972 hurricane season saw few hurricanes but it did bring one of the deadliest and most expensive ones in U.S. history at that time, namely Hurricane Agnes. The storm killed 122 and caused $2.1 billion in damage, mostly in New York and Pennsylvania.
In 1960, the Atlantic hurricane season witnessed a notable Category 5 hurricane named Donna. According to Wikipedia, this hurricane was the longest-lasting hurricane in the history of the Atlantic basin and the worst storm to hit Florida, causing $387 million damages ($2.4 billion in 2000 dollars). Another notable occurrence of the 1960 storm season is that was one of only four times in which two Category 5 hurricanes were recorded, the other one being Hurricane Ethel. Ethel occurred right after Donna, making it the only season with two consecutive Category 5 hurricanes.
The 1936 hurricane season was one of the busiest on record and set many records which remained unbroken until the devastating 2005 season (which included Hurricane Katrina).
The historical record shows that the 6-year cycle bottom/12-year cycle peak tends to produce an active hurricane season for the Atlantic and Gulf Coasts with sometimes devastating results. The cycle’s discoverer, Samuel J. “Bud” Kress, describes the 6-year and 12-year cycles as being two of the most dynamic of the long-term yearly cycles and the one that corresponds closely to the activities relating to man. This is also true of the number 6 in biblical numerology, with 6 being the number assigned by God to man and his activities. Not only does the 6-year cycle have an important impact on the financial market but it’s scope and influence extends even to areas outside the financial realm, suggestive of a cosmological origin.
Thus far into the 2008 hurricane season there have been three hurricanes (the most recent one being Gustav) and four tropical storms. In most years when the 6-year cycle was bottoming while the 12-year was peaking, the worst hurricanes occurred in the month of September. Moreover, the month of September in years when the 6-year cycle is bottoming tends to produce a spike in the crude oil price.
Back in June we looked at the important 10-month oscillator for the crude oil price, a measure of longer-term overbought and oversold pressures. As the indicator clearly showed at that time, the 10-month oscillator was flashing a huge “overbought” reading which led us to conclude there was an intermediate term top in the making. As we wrote in the June 3 commentary, “This overbought extreme is portentous, for it means that crude oil will have tremendous overhead resistance to contend with and will be vulnerable to selling pressure in the weeks and months ahead. The sell signal flashed by this indicator suggests that relief is on the way for the consumer as the oil price should gradually back off its all-time highs.”
At that time the crude oil price was trading around $135/barrel. After a temporary move up to $146, crude has since fallen back to its recent trading low of $111.50 and closed most recently at $115.46 on Aug. 29.
Since flashing the super-overbought internal reading in June, the 10-month price oscillator for crude oil has pulled back and is showing the crude market to be much less overheated than it was just two months ago. The 10-month oscillator is still technically in “overbought” territory but is still low enough compared to its previously record high reading to justify a relief rally in the oil price. Here’s what the latest oscillator chart looks like.
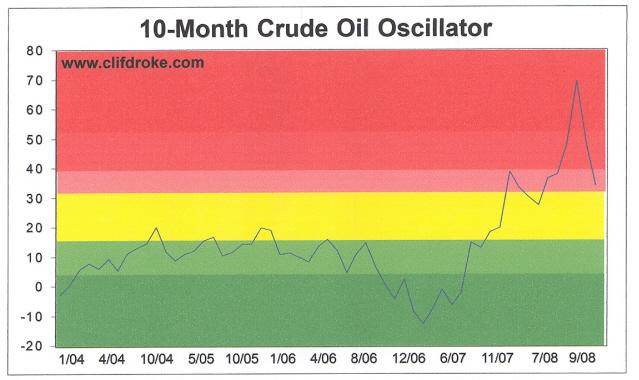
As you can see, the oscillator has fallen to the pink zone and is very close to being in neutral territory (yellow). This is by no means a major buy signal but does suggest a short term rally will begin soon. As discussed earlier in this commentary, September looks to be an ideal time for the oil price to rally off their recent correction lows, especially if hurricane season is as rough as previous 6-year/12-year cycle years have been.
By Clif Droke
www.clifdroke.com
Clif Droke is the editor of the daily Gold & Silver Stock Report. Published daily since 2002, the report provides forecasts and analysis of the leading gold, silver, uranium and energy stocks from a short-term technical standpoint. He is also the author of numerous books, including 'How to Read Chart Patterns for Greater Profits.' For more information visit www.clifdroke.com
Clif Droke Archive |
© 2005-2022 http://www.MarketOracle.co.uk - The Market Oracle is a FREE Daily Financial Markets Analysis & Forecasting online publication.