


Timing the Peak in Stock Market
Stock-Markets / Stock Market 2017 Nov 02, 2017 - 05:27 AM GMT

 Is Stock Market Valuation in Bubble Territory?
Many analysts and forecasters argue that stock market is in bubble territory and about to do significant correction or even a crash. There’s a lot of reasons given, both from fundamental and technical point of view. For example, some popular reasons are:
- The rally in S&P is the second longest run in the history without a 3% pullback
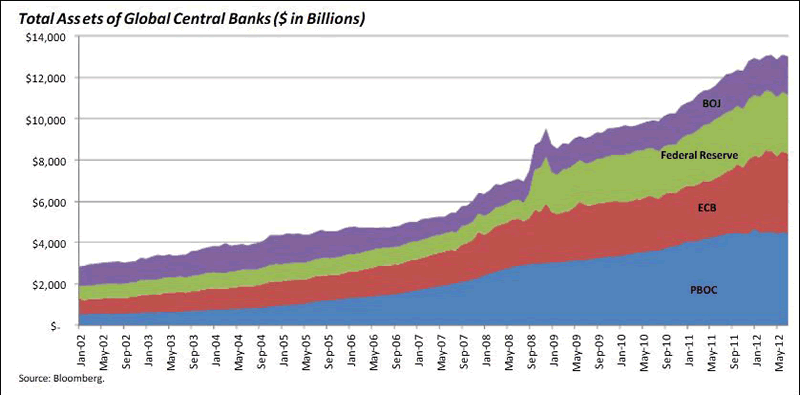
- Assets have risen exponentially due to money printing. This is an unprecedented experiment in the history which can have big repercussion when the bubble pops. The chart below shows Central Bank Assets’ expansion
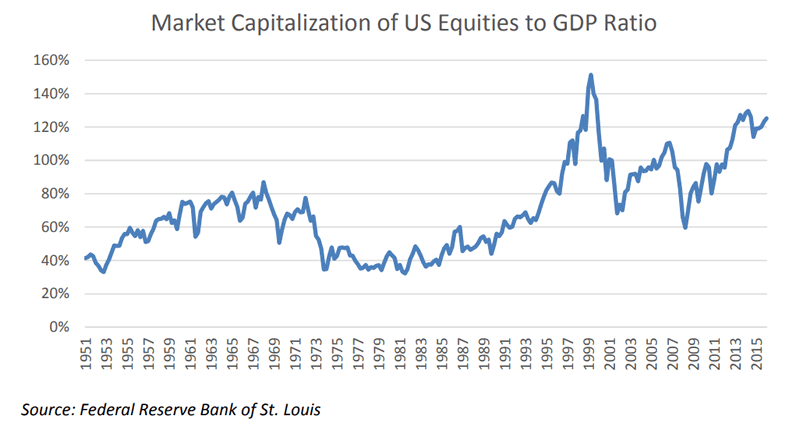
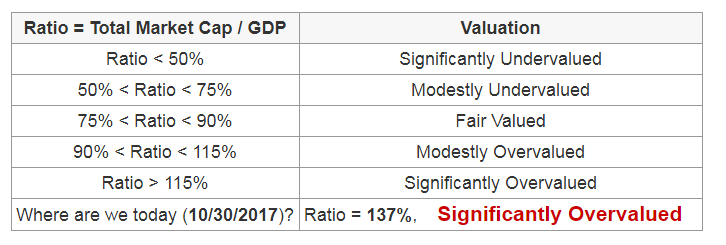
- Warren Buffet’s single favorite indicator Total market capitalization-to-GDP ratio as of this writing stands at 137%. This ratio is currently the second highest in the history and significantly overvalued
These are just 3 reasons and there’s plenty of others. These reasons could be right and stock market may indeed be overvalued. However, problem is the market can stay irrational much longer than you as traders can stay solvent holding wrong position. Stock markets should eventually form peak and do large correction. However, although the direction could eventually be right, if the timing of the call is 5 years too early, then what good is it?
For the average traders, the worst case that can happen is listening to all these warnings and picking a top and trying to short against a clear trend. This could lead to a very big loss to the equity. If traders make trading decisions based on these reasons and short the market in the past 3-5 years, they would not have money left to trade as the market keeps going up and squeeze them. As traders, our priority should be how to make profit and control the risk. Most importantly, traders should follow the trend until it’s over. There’s a popular saying in trading “don’t fight against the trend” but in reality a lot of people like to pick top and bottom. Traders should trade what they see, not what they feel. Algos and machines trade based on trend and sequence and they don’t have feeling.
How Much Longer can Stock Market Rally?
We will attempt to look at the price action to answer this question. First of all, we have argued in our previous article that Global Indices show the same cycle. The overlay of various global indices below suggest there is only 1 market. World Indices all make a major low in 2009 and then a secondary low around February 2016.
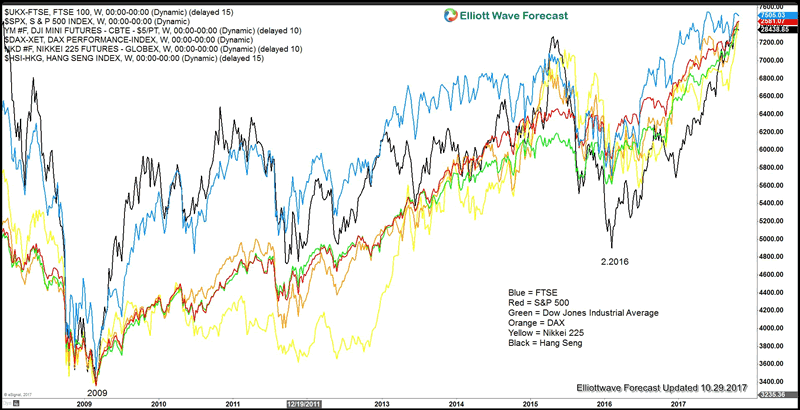
What this means is that if we can see a clear structure in one of the Indices, we can extrapolate our findings to the other Indices. For example, if 1 major stock index could see further upside in the next 5 years, then there’s a possibility the other World Indices will continue to rally also. In our case, we will look at the Hang Seng Index from Hong Kong. The Index has a very nice and clear structure below
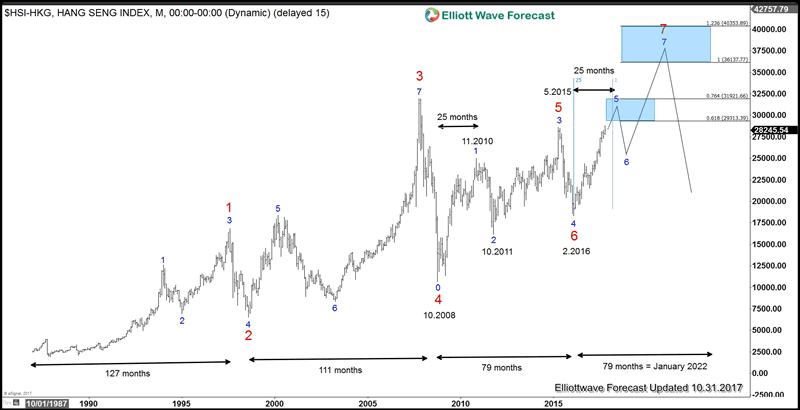
The Hang Seng Index shows a 5 swing sequence from October 2008 low. This 5 swing is denoted in blue color on the chart. A 5 swing sequence (not to be confused with 5 waves impulse) is an incomplete sequence and favors more upside to complete a 7 swing structure. The fifth swing is currently in progress with a target of 29313.39 – 31921.66. We will assume that the time it took from blue 0 – blue 1 (from October 2008 low to November 2010 high) is similar to the time it takes from blue 4 (February 2016) to blue 5. The rally from Oct 2008 low to Nov 2010 high took 25 months. If we add 25 months from February 2016, we will arrive at January 2018. Thus, the current rally in Indices could potentially extend until the end of the year / early next year.
Once the fifth swing ends, we should be looking for a 6th swing pullback to correct the rally from February 2016. The length of time from blue 5 to blue 6 can be extrapolated from the length of time from blue 1 to blue 2. It took 11 months from blue 1 on 11.2010 peak to blue 2 on 10.2011 low. If we end the fifth swing in early 2018 and add 11 months to estimate the sixth swing, the entire 2018 could become a year of correction. However, there’s still 7th swing higher afterwards. The length of time from blue 0 on Oct 2008 low to blue 3 on May 2015 peak is 79 months. If we assume the same time and add 79 months from February 2016 low, we will arrive at January 2022.
In conclusion, unless Hang Seng Index truncates, the path of least resistance for World Indices is to extend higher. Remember there is only 1 market, and if Hang Seng will continue to get supported until year 2022, the other Indices can be supported also. The fifth swing in Hang Seng Index which is in progress could continue until the end of year / early next year. Then we can have a multi-month correction in the sixth swing in 2018. After the sixth swing correction is over, we can still potentially have seventh swing higher which can take us into year 2022.
At Elliottwave-Forecast, we try our best to look at the price action and listen to the market. We try to set aside any bias and our feeling of what the market should have done. We believe until the sequence is complete or Hang Seng truncates, we have no business in trying to fight against a trend or picking a top in World Indices. The bullish sequence remains valid as far as the February 2016 low pivot remains intact.
If you enjoy this article, check our work and join 14 days Trial to see Elliott Wave Forecast in 78 instrument, as well as getting access to Live Trading Room, Live Session, and m
By Ayoub Ben Rejeb
https://elliottwave-forecast.com
ElliottWave-Forecast has built its reputation on accurate technical analysis and a winning attitude. By successfully incorporating the Elliott Wave Theory with Market Correlation, Cycles, Proprietary Pivot System, we provide precise forecasts with up-to-date analysis for 52 instruments including Forex majors & crosses, Commodities and a number of Equity Indices from around the World. Our clients also have immediate access to our proprietary Actionable Trade Setups, Market Overview, 1 Hour, 4 Hour, Daily & Weekly Wave Counts. Weekend Webinar, Live Screen Sharing Sessions, Daily Technical Videos, Elliott Wave Setup .
Copyright © 2017 ElliottWave-Forecast - All Rights Reserved Disclaimer: The above is a matter of opinion provided for general information purposes only and is not intended as investment advice. Information and analysis above are derived from sources and utilising methods believed to be reliable, but we cannot accept responsibility for any losses you may incur as a result of this analysis. Individuals should consult with their personal financial advisors.
© 2005-2022 http://www.MarketOracle.co.uk - The Market Oracle is a FREE Daily Financial Markets Analysis & Forecasting online publication.