


USDCNH Is Forming A Triangle Pattern On 4-Hour Chart
Currencies / China Currency Yuan Nov 06, 2017 - 02:49 PM GMTBy: Franco_Shao

 The USDCNH pair seems to be forming a triangle pattern on its 4-hour chart. The price broke above a falling trend line last Friday, indicating that the short term downtrend from 6.6635 had completed at 6.5840 already.
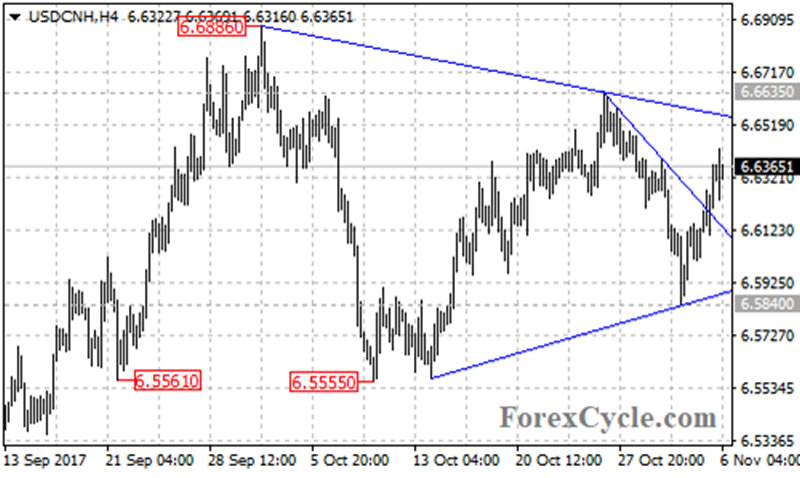
Further rally towards the top trend line of the triangle pattern now at around 6.6550 would likely be seen. A clear break above this trend line could take price to next resistance level at 6.6635. Breakthrough here could trigger further upside movement towards 6.6884 key resistance.
A breakout of 6.6884 level will confirm that the uptrend from 6.4412 has resumed, then next target would be at the support-turned-resistance level at 6.7210. Above this level could see price continue to rise towards 6.8588.
Near term support is at the 6.6100, a breakdown below this level could bring price back to the bottom support trend line of the triangle pattern now at around 6.5885, followed by 6.5840. Below these levels could trigger further downside movement towards 6.5555. Breakthrough here if seen would aim 6.5350, which is the 61.8% Fibonacci retracement taken from 6.4412 to 6.6884, followed by the 76.4% retracement at 6.5000.
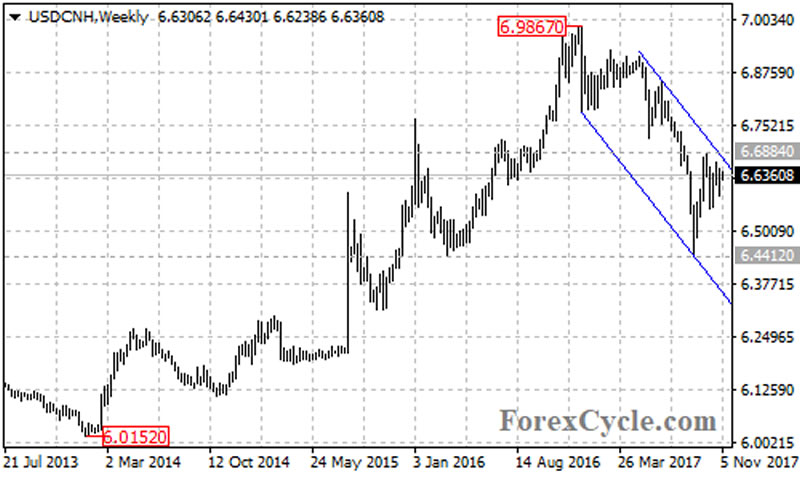
For long term analysis, the USDCNH pair stays in a falling price channel on the weekly chart and remains in the long term downtrend from 6.9867. The price is now facing the top trend line of the channel. As long as the channel resistance holds, the downtrend could be expected resume, and next target would be at 6.3860 which is the 61.8% Fibonacci retracement taken from 6.0152 to 6.9867. Only a breakout of 6.6884 key resistance will indicate that the downtrend had completed at 6.4412 already, then another rise towards 7.0000 important psychological level could be seen.
Technical levels
Support levels: 6.6100, 6.5885, 6.5840, 6.5555, 6.5350, 6.5000, 6.4412, 6.3860.
Resistance levels: 6.6550, 6.6635, 6.6884, 6.7210, 6.8588, 6.9170, 6.9867, 7.0000.
This article is written by Franco Shao, a senior analyst at ForexCycle.
© 2017 Copyright Franco Shao - All Rights Reserved Disclaimer: The above is a matter of opinion provided for general information purposes only and is not intended as investment advice. Information and analysis above are derived from sources and utilising methods believed to be reliable, but we cannot accept responsibility for any losses you may incur as a result of this analysis. Individuals should consult with their personal financial advisors.
© 2005-2022 http://www.MarketOracle.co.uk - The Market Oracle is a FREE Daily Financial Markets Analysis & Forecasting online publication.