


Taxes, Macro Signals, Market Seasonality, US Stocks and Gold Miners
Stock-Markets / Financial Markets 2017 Nov 25, 2017 - 06:39 PM GMTBy: Gary_Tanashian

 While politicians hammer out the details it is generally accepted that corporations and by extension the investor and asset owner classes are targeted for benefits under the coming Republican tax plan. The logical implication of that beneficial treatment is that barring a market meltdown in the interim, people looking to unload stock positions and take profits would tend to wait until January in hopes of gaining the 2018 tax benefit vs. 2017’s tax code.
Among the under performing sectors subject to tax loss selling in late 2017 I have selected the gold miners for this post because they tend to be counter-cyclical and “in the mirror” to the broad risk ‘on’ asset party currently ongoing. We have noted again and again that with the asset party in full swing the miners’ fundamentals cannot possibly look good, and at face value they don’t. Sector fundamentals like gold/oil and gold/materials ratios are not good and macro fundamentals like gold vs. stock markets, the economy (which is relatively strong) and the yield curve are not at all supportive either… as they currently stand.
In a perfect world stock market-to-gold ratios, long-term interest rates and the yield curve would work together to signal a time of change for the macro. The red shaded areas show a logical limit for stocks vs. gold, the 100 month exponential moving average has limited 30 year yields for decades and the yield curve is on the same message, heading toward but not yet to a logical limit.
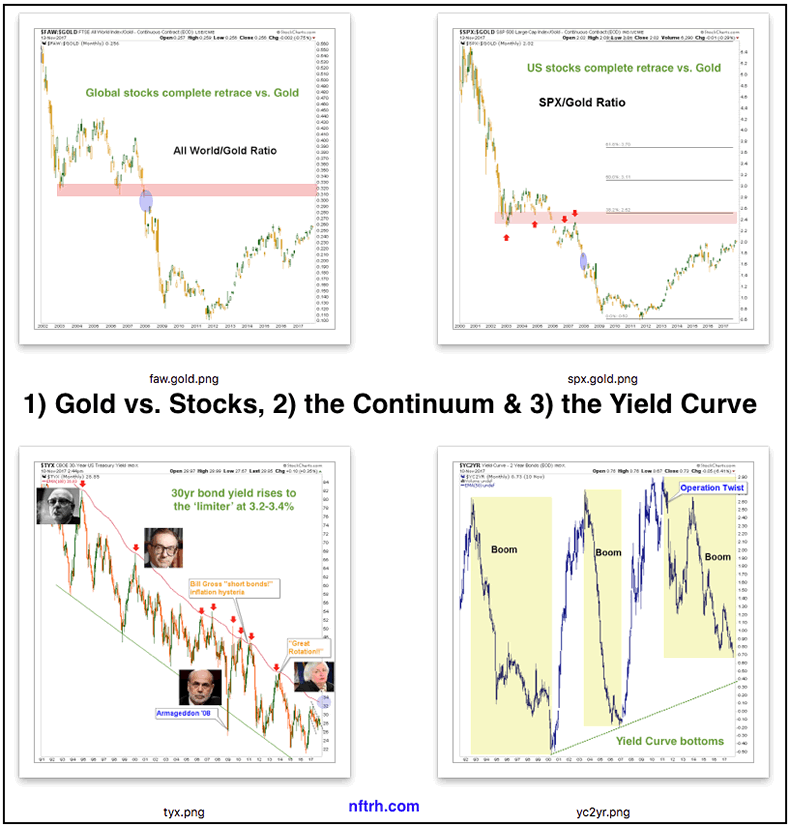
Below is the current status of just one of the macro fundamentals we track, the 10yr-2yr yield curve. The reference to “Op Twist by another name & method” has to do with the curve flattening implications highlighted in this post on Nov. 20. The bond market manipulators led by Ben Bernanke announced an operation to buy long-term debt and sell short-term debt in 2011 with the expressed objective of sanitizing inflationary signals. Well boyz, job well done. The Goldilocks boom particularly, kicked in with the Semiconductor Equipment cycle that we first noted in early 2013.
I have no idea whether they actually named the new scheme, but if Treasury follows through on it they will be trying to continue pressuring the curve to flattening; in other words, trying to keep the good times going… because that is what politicians do and I have little doubt that Sec. Mnuchin is more politician than financial guy. This political guy has announced that he plans to issue more short-term bonds and less long-term bonds in order to rig the yield curve further as the Fed unwinds QE. Of course he is a buttoned down man of great wealth and good taste. He would never use the word “rig”… publicly. That is my word. Again, per the WSJ…
The Treasury’s new approach will shift some of that upward pressure on yields to shorter-term debt and away from longer-term debt.
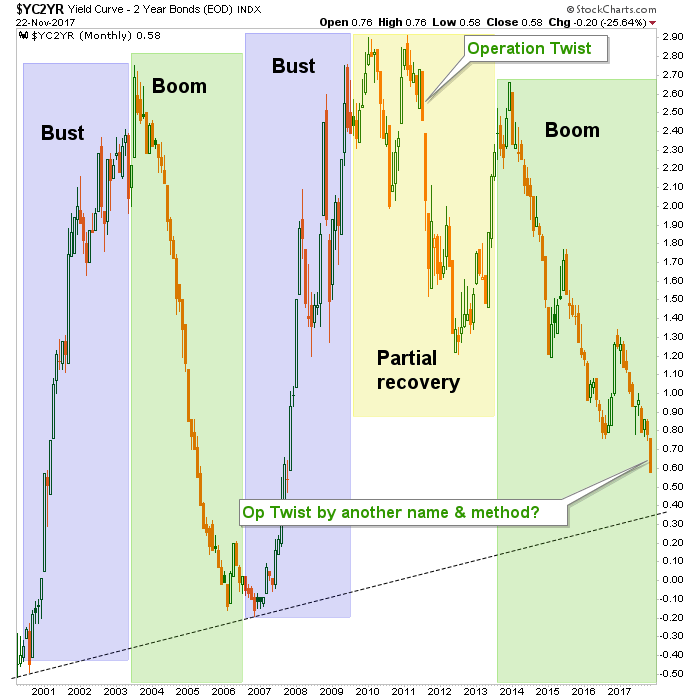
In other words, the goals of the new operation are similar to Twist. The former rammed the macro into boom times and the latter would seek to keep it going. As noted in the post linked above, it seems pretty desperate. If things are so good, why continue flexing the manipulative arms of policy and government? Bueller? Anyone?
So the market can be manipulated but ultimately it will have its way. One wonders about the efficacy of a scheme overlaid on top of an already mature scheme of similar aims. Playing it straight here, the yield curve is, like stock to gold ratios, on its way but not to logical limitations. So for now, it’s party on Garth!
The job of a market manager is to manage the present as unemotionally as possible while looking ahead with sensible plans based on incoming and historical market data. The yield curve has been impulsively flattening, which is indicative of a boom or risk ‘on’ phase and an impairment of the fundamentals for gold and the gold stock sector. It’s just the way it is right now folks.
But what about next month or especially the month after that… or February? We have been cross referencing the above indicators and now can add in a fiscally imposed indicator as well in the form of beneficial changes to the tax code, for the wealthy, the investor class and corporate interests, at least. The stock market bull is going to be rudely interrupted at some point and the question is, at what point? Enter the indicators.
I believe the bull market will probably not end until the next deflationary u-turn, possibly at the 30yr yield limiter around 3.3%, stocks fully retraced vs. gold and the yield curve either inverted, flat or around the trend line noted above. The timing of those conditions can extend indefinitely since they are all big picture markers.
But on the short-term, an overbought stock market that has teased the bears with every little short-term twitch that resolves bullish may at least see the party interrupted if newly tax-unburdened players decide to unload early in the new year. Going the other way, the gold sector, current poor fundamentals and all, has three things potentially going for it…
- We are in the jaws of tax loss selling season for this under performing sector, and…
- The seasonal aspect for gold and the miners is constructive for a December or January secondary low, and…
- By definition, any interruption in the risk ‘on’ markets bull phase would favor risk ‘off’ gold and its counter-cyclical miners. US and many global markets are overbought and the US at least, has a new tax benefit wrinkle in the mix.
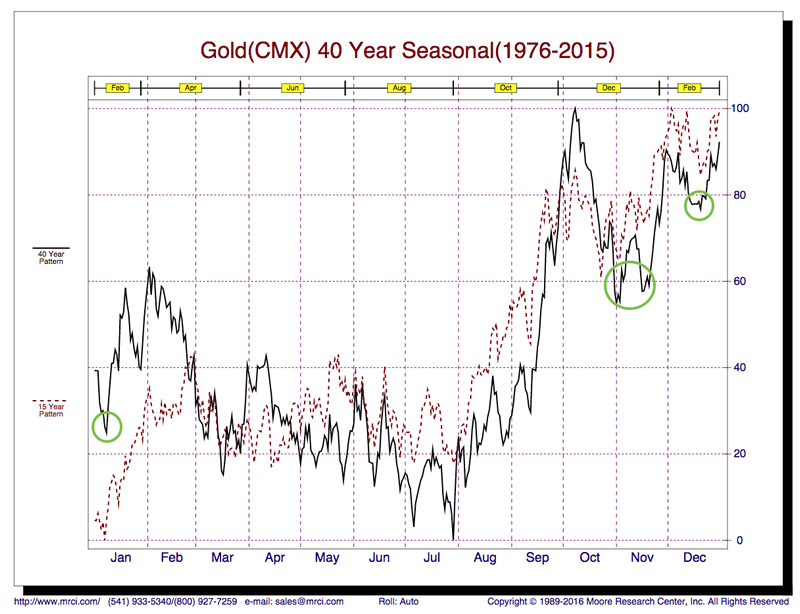
Let’s end with a look at the seasonal setup in gold and the miners as tax loss selling season progresses and tax gain selling season approaches. Gold’s 40 year seasonal average (Source: mrci.com) shows a corrective low in October/November () and secondary lows in December and January. A literal interpretation (not recommended, but it is a frame of reference) is for strength from mid-December through January. Given the status of gold’s Commitments of Traders, it would be best to keep the bullish view restrained beyond January.
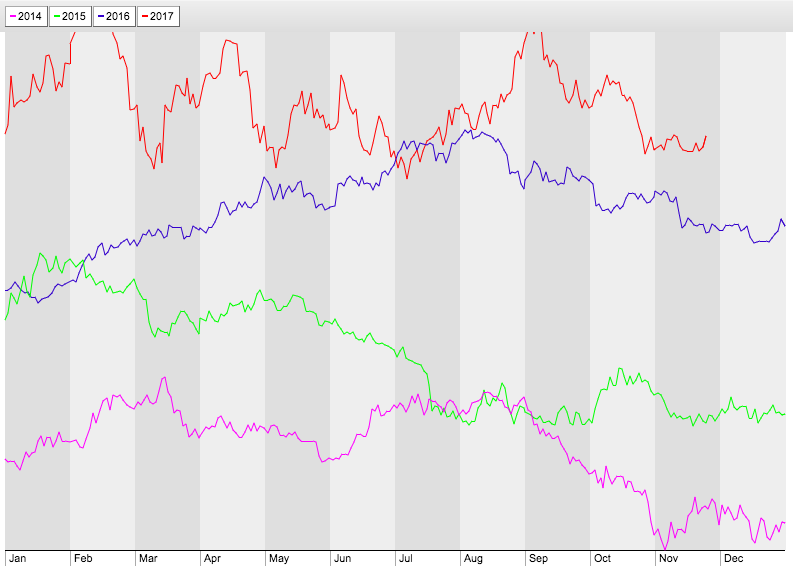
HUI checks in with a view of the 2014 and 2015 bear market years along with what may have been the first year of a new bull market, 2016. In all three cases the index bottomed in either November, December or January (also, let’s not forget 2017’s rally into mid-February). In the case of 2014’s November low, after a bottom retest in December a good rally followed into mid-March. In 2015 HUI bottomed in November, went sideways and had a surge in January. Those were bear market rallies and so, were limited after the seasonal played out.
2016, which I believe may have been the bear market low, bottomed in January and then impulsively worked its way upward until the over-hyped sector fell apart as its fundamentals degraded (in this post we used the gold/oil ratio as just one example).
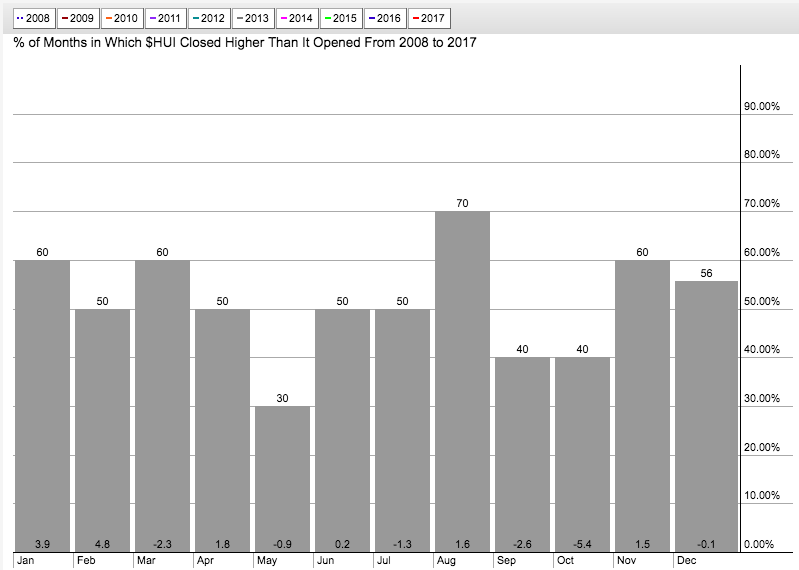
Now, lest the above appear to be cherry picking of years, let’s expand HUI’s seasonal to 2008, so that we can smooth it out to include both bull and bear cycles. As you can see January and February have been the most bullish months with gains of 3.9% and 4.8%, respectively.
Bottom Line
A combination of a fiscal policy event (tax reform) and seasonal aspects could set up counter trend moves in the risk ‘on’ stock market and the much more risk ‘off’ gold sector. Noting the larger trends, if this comes about it could just be a counter trend move in the still bullish stock market and still bearish gold sector. It will depend on when the big macro signals register (they move oh so slowly).
My current tack is to remain balanced within stock market segments with some counterweight positions in quality gold stocks. Tax selling season is still in effect, so there could be some volatility near-term but there seems a pretty good potential of a shakeout of recent trends as we move into 2018. NFTRH will be charting the best gold stocks (per my view and especially per the views of trusted associates/fundamental sources) more intensively now, along with our ongoing regular coverage of broad markets and stocks. Consider an affordable membership ahead of time, rather than after the fact as we prepare for coming events.
Subscribe to NFTRH Premium for your 40-55 page weekly report, interim updates and NFTRH+ chart and trade ideas or the free eLetter for an introduction to our work. Or simply keep up to date with plenty of public content at NFTRH.com and Biiwii.com. Also, you can follow via Twitter ;@BiiwiiNFTRH, StockTwits, RSS or sign up to receive posts directly by email (right sidebar).
By Gary Tanashian
© 2017 Copyright Gary Tanashian - All Rights Reserved
Disclaimer: The above is a matter of opinion provided for general information purposes only and is not intended as investment advice. Information and analysis above are derived from sources and utilising methods believed to be reliable, but we cannot accept responsibility for any losses you may incur as a result of this analysis. Individuals should consult with their personal financial advisors.
Gary Tanashian Archive |
© 2005-2022 http://www.MarketOracle.co.uk - The Market Oracle is a FREE Daily Financial Markets Analysis & Forecasting online publication.