


Never Mind Tea Leaves, Here’s a Strong Signal from the Economic Dashboard
Economics / US Economy Dec 17, 2017 - 03:32 PM GMTBy: F_F_Wiley

 We’ve been seeing more and more commentaries discussing bad stuff that can happen when the Fed tightens policy and, as a result, the yield curve flattens. (See, for example, this piece from Citi Research and ZeroHedge.) No doubt, the Fed’s rate hikes will lead to mishaps as they usually do—in both markets and the economy. But most forecasters expect the economy to expand through next year, believing that the Fed and the yield curve aren’t yet restrictive enough to trigger a recession.
We won’t make a full-year 2018 forecast here, but we’ll share one of our “dashboard” charts that supports the consensus view for at least the first half of the year. With one methodological change to a chart we published in August, we’ll look at the following indicators, which together have an excellent track record predicting the business cycle:
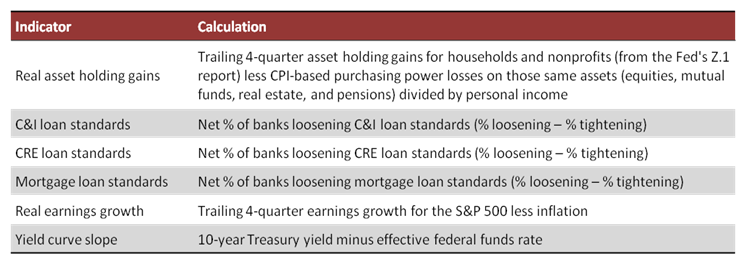
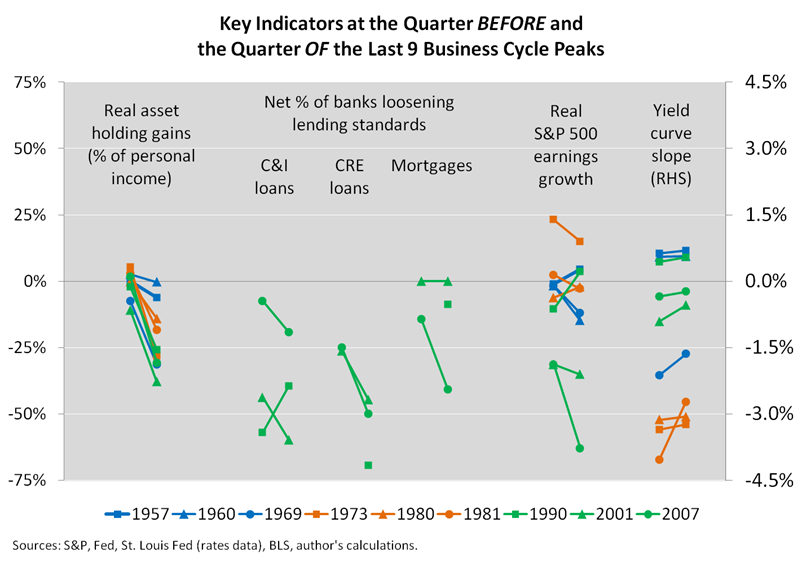
The idea is that the economy tends to turn over when investors lose money, borrowers find it hard to obtain financing, business earnings weaken, and banks struggle with a flat or inverted yield curve. Here’s a history of all four of those indicators in the quarter before and the quarter of the last nine business cycle peaks, although with less data for lending standards, which the Fed began surveying for the first time in mid-1990:
With that history as our background (in charcoal gray), our dashboard highlights the most recent data, along with our fourth quarter estimates for asset price gains and S&P 500 earnings growth:
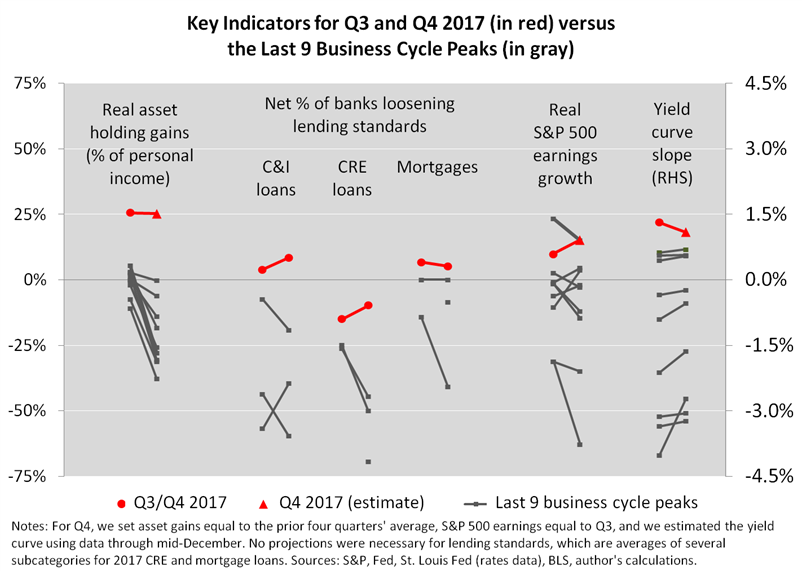
In our view, the above chart is the best way to judge recession risks—with a strong reminder of how current conditions compare to the conditions that shaped past business cycles. That comparison looks favorable as of mid-December, just as it did in August. Here are our takeaways, moving from right to left along the chart:
- Although the yield curve is likely to become more recessionary as the Fed continues to tighten, it’s not yet as flat or inverted as it normally is at business cycle peaks.
- Business earnings aren’t yet recessionary, either, although gains over the last four quarters reflect depressed earnings in 2015 and 2016, which isn’t quite as bullish a signal as it would be if earnings had risen consistently over that period.
- Outside of the commercial real estate sector, lending conditions aren’t constraining borrowing growth, and even CRE lending conditions aren’t restrictive when compared to the last three business cycle peaks.
- Asset gains have been stellar over the past four quarters, far above the flat or declining performance that nearly always precedes business cycle peaks.
We think the last point is the most convincing. Of all the “rules” in economics, the rule that asset prices lead the business cycle is as reliable as any, and they’re a long way from recessionary as of this writing. In fact, if Q4’s gains match the average gains over the past four quarters, real asset gains for 2017 will reach 25% of personal income. That’s three months of personal income from asset gains alone—hardly an environment where households stop spending and the economy slips into recession.
But eventually, monetary tightening will have greater effects, and the outsized asset gains of recent years will become more burden than boon. That’s notwithstanding Janet Yellen’s FOMC press conference on Wednesday, where she downplayed risks posed by soaring asset prices. Yellen’s parting words are certainly welcoming of debate, and we recommend the responses here and here, as well as this recent report from the Office for Financial Research. But for this article, we’ll just balance our bullish economic view for H1 2018 with a chart we first shared last week:
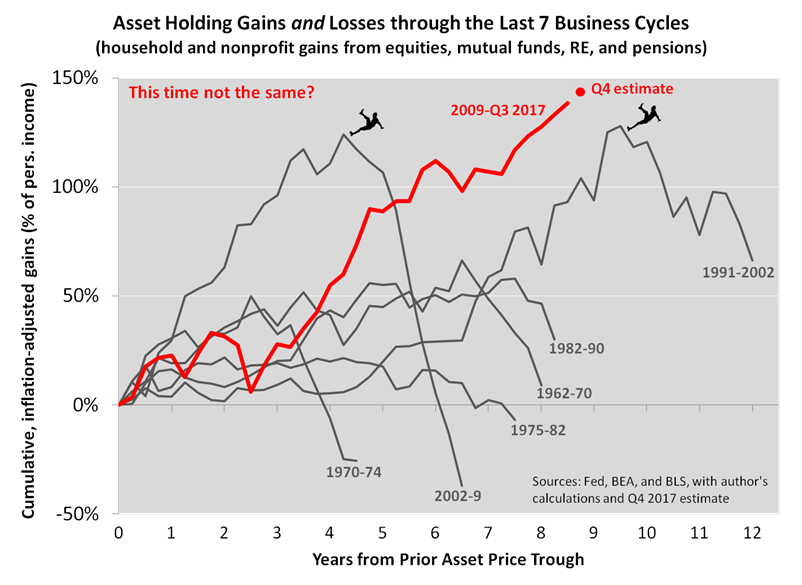
Although the chart includes only seven business cycles to keep it readable, the full history shows asset gains, adjusted for inflation, jumping above those of any other cycle since the Fed began recording gains in 1947. It paints a bigger picture behind the “virtuous” loop that’s currently fueling the economy and thus far impervious to the Fed’s snail-pace tightening. And we think it describes the greatest challenge Yellen’s successor will face, although not an immediate challenge. In our view, the tightening we’ve seen to date is still too new and too tepid to threaten the usual damage, especially with the dashboard readings above and with fiscal policy set to loosen. But further out, we suggest trusting the history of how long-running virtuous loops normally unwind.
Author’s note: For more of the details and rationale behind our “dashboard” or “checklist” methods of forecasting, please see our book Economic for Independent Thinkers.
F.F. Wiley
F.F. Wiley is a professional name for an experienced asset manager whose work has been included in the CFA program and featured in academic journals and other industry publications. He has advised and managed money for large institutions, sovereigns, wealthy individuals and financial advisors.
© 2017 Copyright F.F. Wiley - All Rights Reserved
Disclaimer: The above is a matter of opinion provided for general information purposes only and is not intended as investment advice. Information and analysis above are derived from sources and utilising methods believed to be reliable, but we cannot accept responsibility for any losses you may incur as a result of this analysis. Individuals should consult with their personal financial advisors.
© 2005-2022 http://www.MarketOracle.co.uk - The Market Oracle is a FREE Daily Financial Markets Analysis & Forecasting online publication.