


Why Oil Should Be Supported in Weekly Chart
Commodities / Crude Oil Jan 11, 2018 - 01:05 PM GMT

 Hello fellow traders, in this blog post, we will discuss oil in a more bigger picture.
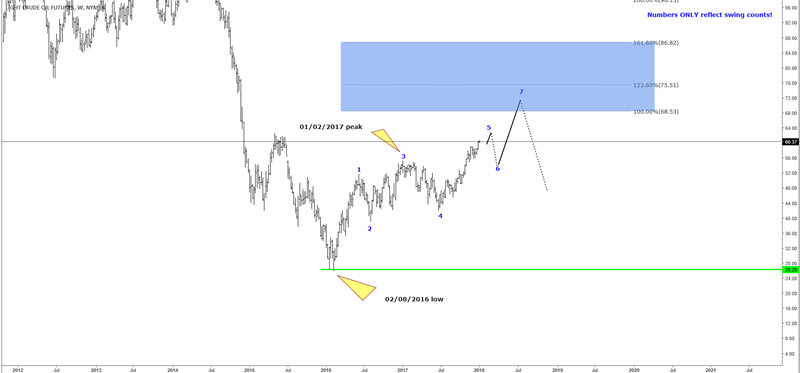
In the chart below, you can see crude oil futures on the weekly chart.
From the 02/08/2016 low, we can clearly see that the market has a potential 5 swing incomplete bullish sequence. It seems like that it is still in the fifth swing. The weekly target for us is between 68.53-86.82. Please note a 5 swing sequence is different than 5 waves impulse. Overall, we can conclude that we need more upside in oil and we suggest members to buy the instrument in 3-7-11 swings to the upside.
Oil Weekly Chart
With that said I want to present to you another important instrument we follow. It is called the Wisdomtree Continuous Commodity Index (GCC).
The GCC is basically a basket of diversified different commodity exposure. In the image below you can see the different components of the index.
GCC Components
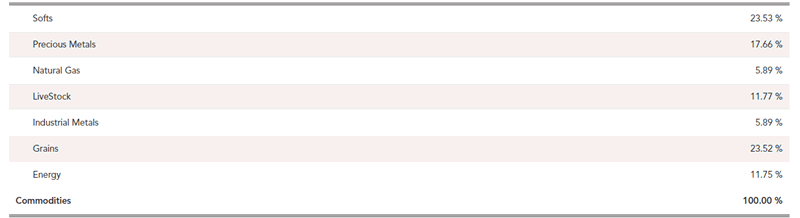
Source: https://www.wisdomtree.com/etfs/alternative/gcc
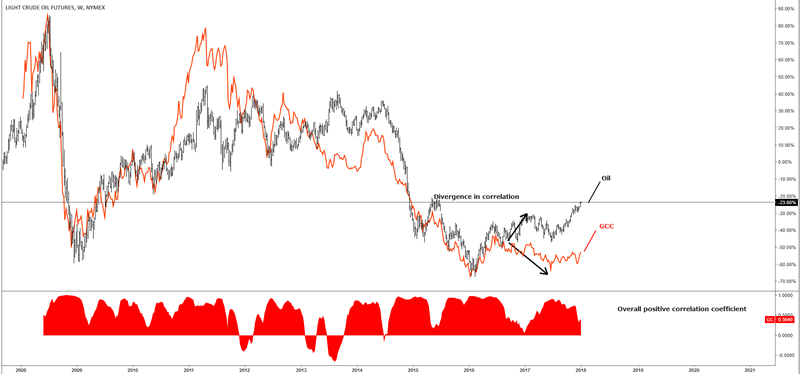
But why do we need the GCC to forecast crude you might ask yourself. Well, that’s pretty easy to answer. Please have a look at the chart below. You can see the crude chart simply overlayed with the GCC index. You can clearly see, that both markets are correlating big time. Obviously, we need to understand that correlation is never pip by pip. This means that we have times where both the markets are diverging to each other. As you can see in in the arrows below. Oil is going higher whereas the GCC made new lows. But that doesn’t change the overall degree of correlation.
Oil vs GCC
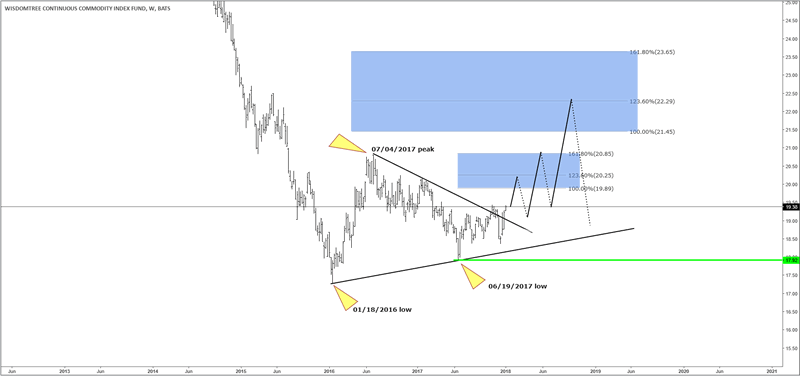
Now let’s have a look at the GCC chart below. You can see that the market never broke above 07/04/2017, whereas oil broke the high. However, from the 06/19/2017 low, the GCC has, in fact, a bullish sequence, targeting the area of 19.89-20.85. Which makes it bullish against that level. This means that oil will also continue higher in a longer-term perspective.
GCC Weekly Chart
We believe in cycles, distribution, and many other tools in addition to the classic or new Elliott wave Principle. To get a regular update on the market and Elliott wave charts in 4-time frames, try our service for 14 days for FREE. Click Here.
If you enjoy this article, check our work and join HEREto see Elliott Wave Forecast in 4-time frames for 78 instruments as well as getting access to Live Trading Room, Live Session, and more.
By Ayoub Ben Rejeb
https://elliottwave-forecast.com
ElliottWave-Forecast has built its reputation on accurate technical analysis and a winning attitude. By successfully incorporating the Elliott Wave Theory with Market Correlation, Cycles, Proprietary Pivot System, we provide precise forecasts with up-to-date analysis for 52 instruments including Forex majors & crosses, Commodities and a number of Equity Indices from around the World. Our clients also have immediate access to our proprietary Actionable Trade Setups, Market Overview, 1 Hour, 4 Hour, Daily & Weekly Wave Counts. Weekend Webinar, Live Screen Sharing Sessions, Daily Technical Videos, Elliott Wave Setup .
Copyright © 2018 ElliottWave-Forecast - All Rights Reserved Disclaimer: The above is a matter of opinion provided for general information purposes only and is not intended as investment advice. Information and analysis above are derived from sources and utilising methods believed to be reliable, but we cannot accept responsibility for any losses you may incur as a result of this analysis. Individuals should consult with their personal financial advisors.
© 2005-2022 http://www.MarketOracle.co.uk - The Market Oracle is a FREE Daily Financial Markets Analysis & Forecasting online publication.