


Gold Stocks GDXJ Breaking Out
Commodities / Gold and Silver Stocks 2018 Jan 17, 2018 - 10:52 AM GMT

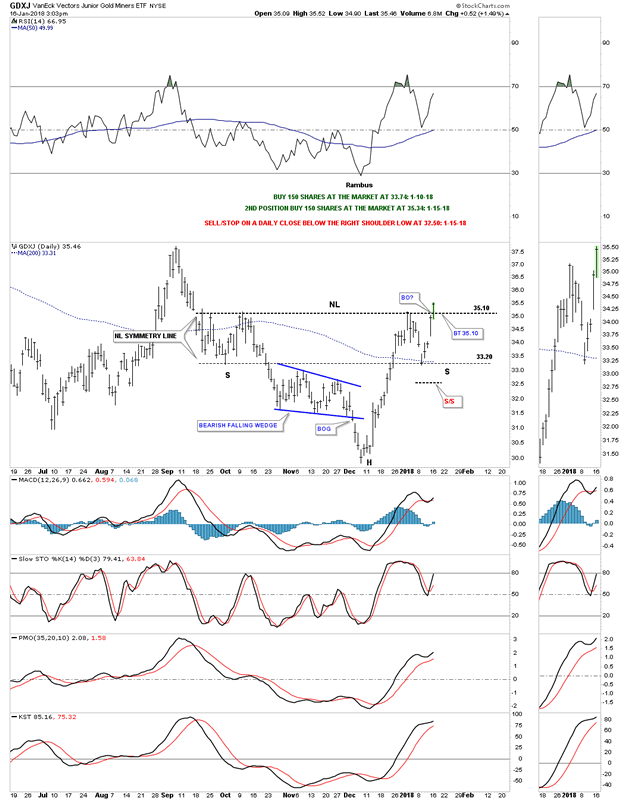
 Today the GDXJ is breaking out above its neckline. Again I was looking for a little more chopping action between the neckline and the neckline symmetry line before the breakout, but so far it’s not happening. I’m going to take my second position and buy 150 shares at the market at 35.34 with the sell/stop at 33.31 for now. A backtest to the neckline would come in around the 35.10 for a slightly lower risk entry point.
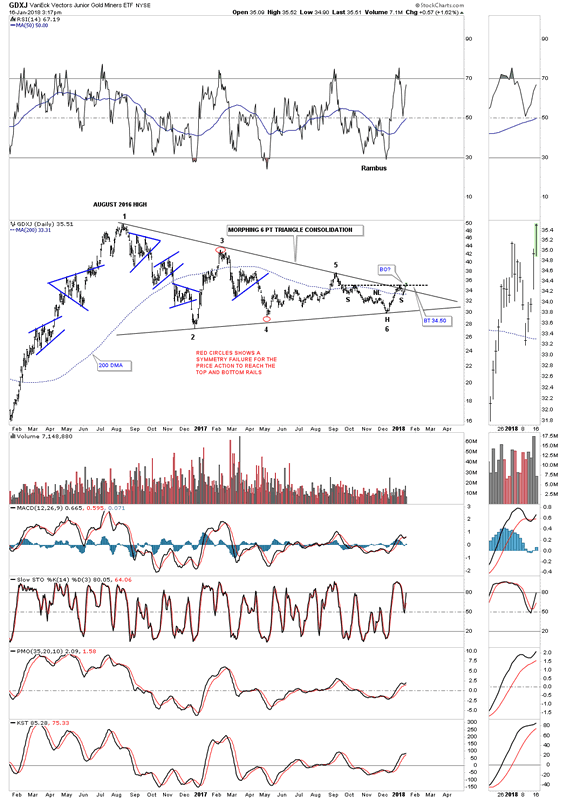
Below is a longer term daily chart which shows the price action since the August 2016 high as a big morphing triangle consolidation pattern as shown by the red circles. The 6th reversal point has formed the H&S bottom which we’ve seen in other big consideration patterns is generally a very bullish setup.
All the best
Gary (for Rambus Chartology)
FREE TRIAL - http://rambus1.com/?page_id=10
© 2018 Copyright Rambus- All Rights Reserved
Disclaimer: The above is a matter of opinion provided for general information purposes only and is not intended as investment advice. Information and analysis above are derived from sources and utilising methods believed to be reliable, but we cannot accept responsibility for any losses you may incur as a result of this analysis. Individuals should consult with their personal financial advisors.
© 2005-2022 http://www.MarketOracle.co.uk - The Market Oracle is a FREE Daily Financial Markets Analysis & Forecasting online publication.