


Gold Miners Bullish GDX ETF
Commodities / Gold & Silver Stocks Sep 07, 2008 - 12:42 AM GMTBy: Mike_Paulenoff

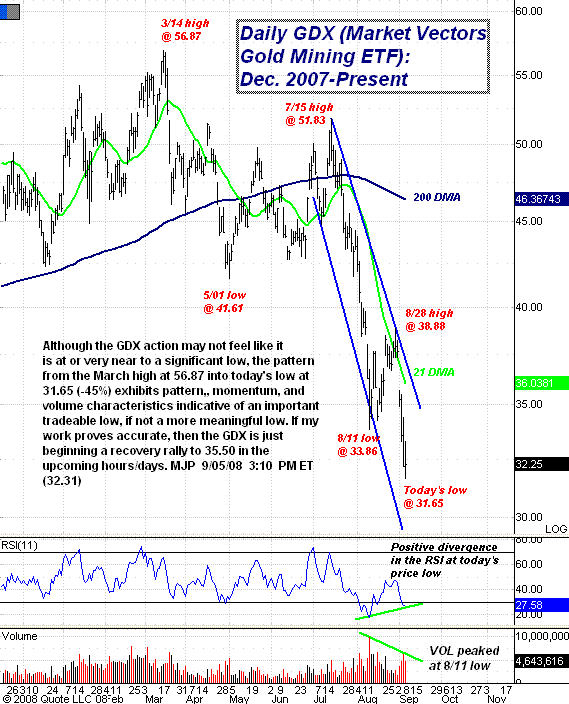
 Although the Market Vectors Gold Miners ETF (GDX) action may not feel like it is at or very near to a significant low, the pattern from the March high at 56.87 into Friday's low at 31.65 (-45%) exhibits pattern, momentum and volume characteristics indicative of an important tradable low, if not a more meaningful low. If my work proves accurate, then the GDX is just beginning a recovery rally to 35.50 in the upcoming days.
The fact that I like the gold miners ETF technically does NOT mean that I also like the gold price ETF (GLD). In fact, while my work is "warning" me that the gold mining stock index is at or near a significant, tradable low, I have my doubts about the pattern that has unfolded in spot gold (and the GLD).
My technical work points to additional downside price action that presses the GLD into the 75.80-74.90 target zone prior to a sustainable recovery rally effort.
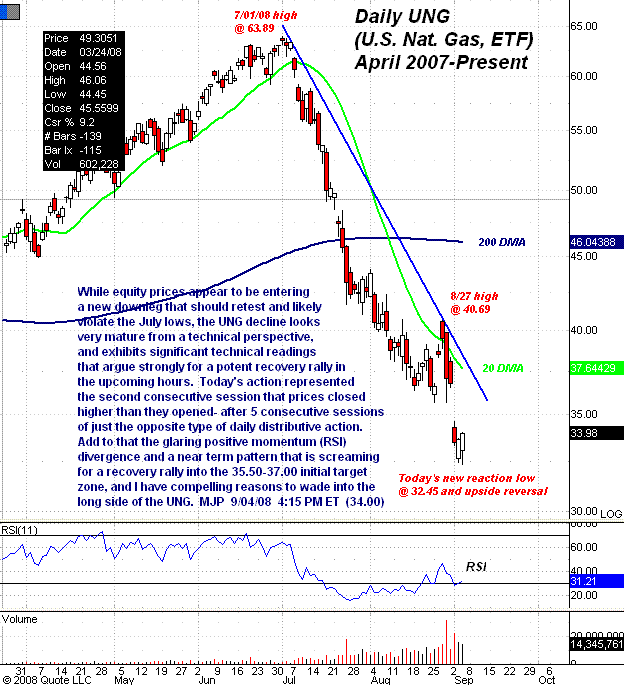
I also like the prospects for natural gas. As we noted to our subscribers on Thursday, "While equity prices appear to be entering a new downleg that should retest and likely violate the July lows, the U.S. Natural Gas Fund (UNG) decline looks very mature from a technical perspective and exhibits significant technical readings that argue strongly for a potent recovery rally in the upcoming hours. Thursday's action represented the second consecutive session that prices closed higher than they opened, after five consecutive sessions of just the opposite type of daily distributive action. Add to that the glaring positive momentum (RSI) divergenes and a near-term pattenr that is screaming for a recovery rally into the 35.50-37.00 initial target zone, and I have compelling reasons to wade into the long side of the UNG."
Sign up for a free 15-day trial to Mike's ETF Trading Diary today.
By Mike Paulenoff
Mike Paulenoff is author of the MPTrader.com (www.mptrader.com) , a real-time diary of Mike Paulenoff's trading ideas and technical chart analysis of Exchange Traded Funds (ETFs) that track equity indices, metals, energy commodities, currencies, Treasuries, and other markets. It is for traders with a 3-30 day time horizon, who use the service for guidance on both specific trades as well as general market direction
© 2002-2008 MPTrader.com, an AdviceTrade publication. All rights reserved. Any publication, distribution, retransmission or reproduction of information or data contained on this Web site without written consent from MPTrader is prohibited. See our disclaimer.
Mike Paulenoff Archive |
© 2005-2022 http://www.MarketOracle.co.uk - The Market Oracle is a FREE Daily Financial Markets Analysis & Forecasting online publication.