


Wells Fargo WFC Remains Bullish
Stock-Markets / Stock Markets 2018 Feb 09, 2018 - 03:45 PM GMT

 Wells Fargo (NYSE: WFC) is the world’s second-largest bank by market capitalization and the third largest bank in the U.S. by assets.
Last week, the Bank was fined $185M by the FED for ‘widespread illegal practices’ because of the recent fake accounts scandal and it was banned from growing until it convinces authorities it’s addressing shortcomings.
It’s stock plunged 10% this week, its biggest correction in the recent 2 years & it’s biggest single-day drop since the financial crisis. Analysts at firms including Citi, JPMorgan, Morgan Stanley and RBC already downgraded their ratings for the company and the media is transmitting the message that investors have lost faith in the San Francisco financial giant.
However, if we take a look at the technical chart of WFC, we’ll understand that the reason for the drop was purely a technical move and have nothing to do with the recent news.
WFC Daily Chart 05.02.2017
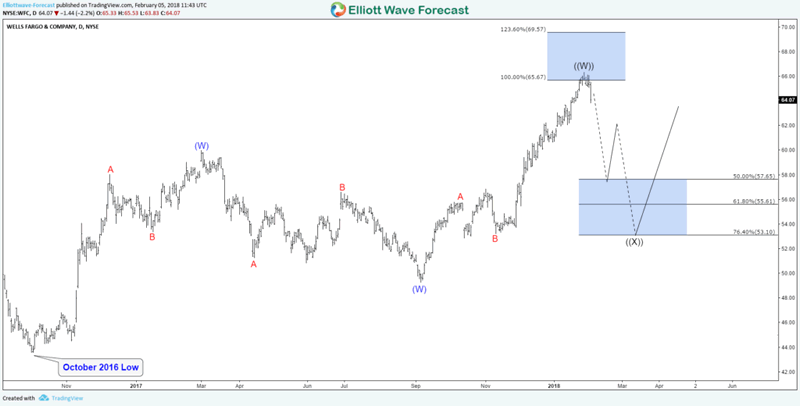
Since October 2016 low, WFC did a 7 swings double three structure which managed to reach the target around equal legs area $65.67. So technically the move had enough number of swings and it was expected to see at least 3 waves pullback to correct that cycle toward the 50% – 61.8% Fibonacci retracement area $57.65 – $55.61.
We believe that market is ruled by technical analysis and the fundamental news is only used to trigger the move which was exactly what happens with Wells Fergo as the Fed sanctions came after the fact that WFC already reached the technical target. The reaction came from the blue box which is a high-frequency area where the markets are likely to end cycles and make a turns.
What will be the next move for WFC?
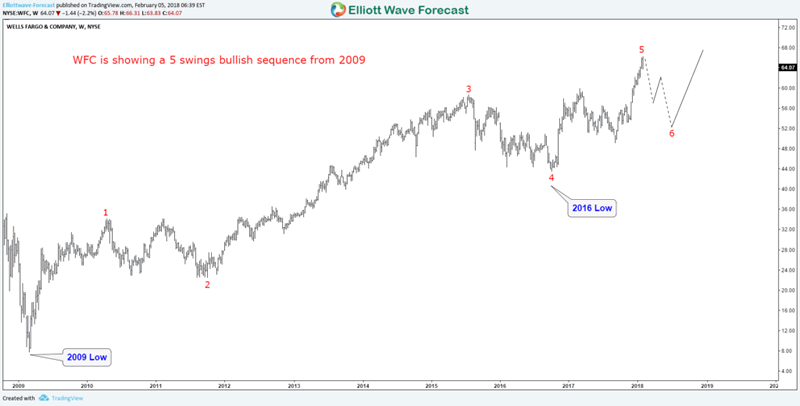
In the above chart, we can see that WFC is showing a bullish 5 swings from the 2009 low, which is different from the regular 5 waves structure. We consider the sequence as incomplete and as long as it remain above the 2016 low then the stock should rally to new highs targeting $94 – $106 area to finish 7 swings move.
Later on, if the stock fails to break to new highs then it can end 2009 cycle as a diagonal 5 waves resulting in a larger correction in 3 waves followed by a new rally.
Consequently, WFC remains bullish despite the recent plunge as the technical picture is still supporting more upside. Currently, it’s only correcting the cycle from 2016 low in 3 , 7 or 11 swings where buyers are expected to show up for 3 waves bounce at least.
If you want to learn more the new Elliott Wave Theory using our system then take this opportunity and try our services 14 days. You’ll learn how to trade Stocks and ETFs using our blue boxes and the 3, 7 or 11 swings sequence. You’ll also get access to our 78 instruments updated in 4 different time frames, Live Trading & Analysis Session done by our Expert Analysts every day, 24-hour chat room support and much more.
By Ayoub Ben Rejeb
https://elliottwave-forecast.com
ElliottWave-Forecast has built its reputation on accurate technical analysis and a winning attitude. By successfully incorporating the Elliott Wave Theory with Market Correlation, Cycles, Proprietary Pivot System, we provide precise forecasts with up-to-date analysis for 52 instruments including Forex majors & crosses, Commodities and a number of Equity Indices from around the World. Our clients also have immediate access to our proprietary Actionable Trade Setups, Market Overview, 1 Hour, 4 Hour, Daily & Weekly Wave Counts. Weekend Webinar, Live Screen Sharing Sessions, Daily Technical Videos, Elliott Wave Setup .
Copyright © 2018 ElliottWave-Forecast - All Rights Reserved Disclaimer: The above is a matter of opinion provided for general information purposes only and is not intended as investment advice. Information and analysis above are derived from sources and utilising methods believed to be reliable, but we cannot accept responsibility for any losses you may incur as a result of this analysis. Individuals should consult with their personal financial advisors.
© 2005-2022 http://www.MarketOracle.co.uk - The Market Oracle is a FREE Daily Financial Markets Analysis & Forecasting online publication.