This Chart Says Gold Is Beginning a Long-Term Uptrend
Commodities / Gold and Silver 2018 Feb 14, 2018 - 05:27 PM GMTBy: GoldSilver
 There aren’t many investment scenarios you can point to with any degree of certainty and say, “This asset is going to rise.” Saying so is usually fraught with risk, even if in hindsight it turns out to have been an accurate call.
But there are certainly times when you can see that the odds are heavily stacked in your favor. And we have one of those potential scenarios right now in gold.
It’s a rather strong setup, based on a simple algebraic equation: if A happens, then B is likely to happen. And in this case A equals the direction of the US dollar.
As most readers know, gold and the US dollar are inversely correlated. Which makes sense; since gold is priced in greenbacks, it tends to rise in value if the dollar falls. And vice versa. Like most inverse correlations, it’s not a perfect “one goes up exactly 1.2%, the other falls exactly 1.2%” pairing, but it’s especially accurate over long periods.
So if the dollar has begun a long-term decline, it would be reasonable to expect the gold price to rise during that span.
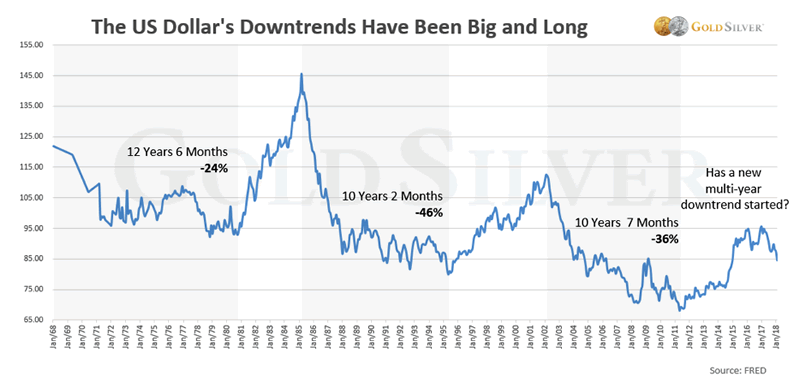
The US dollar has had some very long, very big declines since the late 1960s.

The average of the three major declines was 35.3% over an average span of 11 years.
And as you can see, it looks like the dollar is rolling over again, starting another one of its long-term descents. This seems supported by the lower highs and lower lows it has exhibited since 1985.
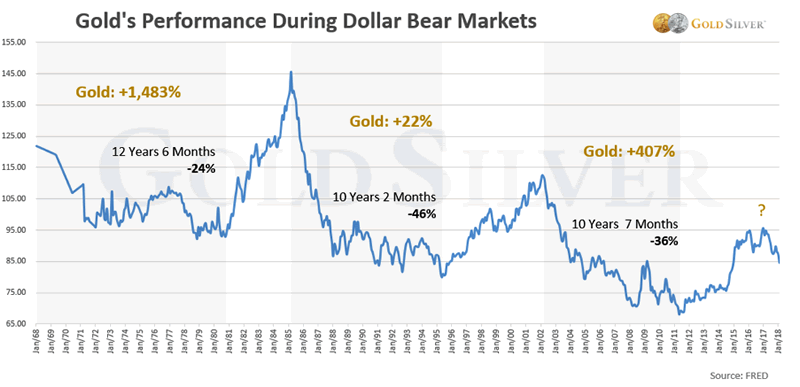
So how did gold perform during these long-term dollar bear markets?

While gold’s rise varied greatly, it rose in all three dollar bear markets. The average gain was 637%.
And by the way, those percentage gains are based on the average annual price, so those returns as an investment were actually achievable (and potentially even greater).
What happened from the mid-80s to mid-90s? You’ll recall this was only a few short years after gold’s biggest rise in modern history (2,328% over 10 years, ending in 1980). So it’s not exactly shocking that gold didn’t rise much after that kind of run. And of course we have the opposite situation today—gold fell for four years, bottoming in 2015, and has risen only 25% since then.
Bottom line, it seems likely that a new long-term bear market is beginning in the US dollar, which would mean gold is beginning a new long-term uptrend. And of course if the dollar falls to its intrinsic value—zero—the rise in gold will be of manic proportions.
What will ultimately happen to the US dollar? And if it does go to zero, what currency will be used and how will transactions take place?
We can speculate on those answers, but odds are we’re going to find out one way or the other. Wouldn’t you want to own lots of gold and silver at that time?
I certainly do, and here’s what I’m buying right now.
Source: https://goldsilver.com/blog/this-chart-says-gold-is-beginning-a-long-term-uptrend/
© 2018 Copyright GoldSilver - All Rights Reserved Disclaimer: The above is a matter of opinion provided for general information purposes only and is not intended as investment advice. Information and analysis above are derived from sources and utilising methods believed to be reliable, but we cannot accept responsibility for any losses you may incur as a result of this analysis. Individuals should consult with their personal financial advisors.
© 2005-2022 http://www.MarketOracle.co.uk - The Market Oracle is a FREE Daily Financial Markets Analysis & Forecasting online publication.


