


Stock Market Breakout Rally will Squeeze Shorts In March
Stock-Markets / Stock Markets 2018 Feb 20, 2018 - 11:58 AM GMTBy: Chris_Vermeulen

 Our proprietary price modeling systems are showing us that our expected price basing, which we have been warning our members of for near 3 months, has altered in range and scope. What we did expect to happen near February 21 is now expected to START sometime between February 21 and February 26. In other words, we are warning our clients that a moderate downside move is expected in the US majors through most of this current week ending near the end of February before a strong rally in prices is likely to begin.
At www.TheTechnicalTraders.com, we are constantly using our proprietary price modeling systems and price cycling systems to determine when and where the next trading opportunity will happen. We’ve posted a number of research reports to the public to assist all traders and investors throughout this year. We called the early rally in the US majors weeks before it started. We called the correction months before it happened. We called the bottom in this volatile rotation and told all our members that we believed prices would accelerate higher after a tight pennant formation completed. Now, we are warning our members to prepare for a mild to moderate downward price rotation to an extended 3~5 day basing pattern near Feb 25 through Feb 27. This basing pattern should be a perfect opportunity for intermediate-term swing traders to initiate and setup trades headed into the March 15 price peak we have been telling you about.
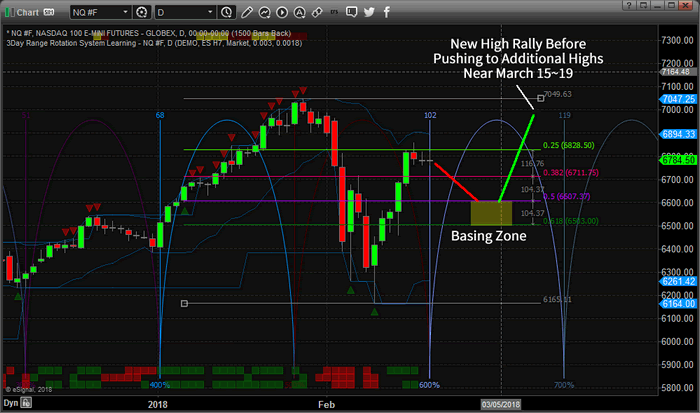
This NQ chart clearly shows the markets have sufficiently retraced (in this case nearly 75%) and have stalled. This move aligned perfectly with our cycle definitions and our projected higher price activity. Now, our proprietary Adaptive Dynamic Learning (ADL) modeling system is telling us the BASING ZONE is likely to happen near the end of February – not near the February 21 date we saw earlier in the year. So, we are altering our scope of analysis to address this change by telling readers to expect a downward price move over the next 5~7 days into the BASING ZONE before the next leg of a rally begins.
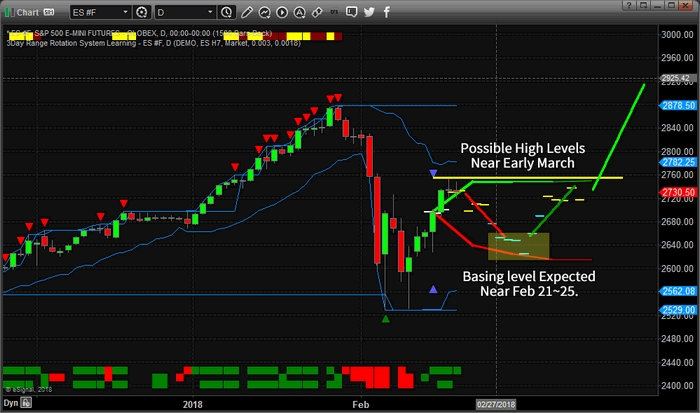
This ES chart presents a similar picture and shows our ADL system at work. You can see from the DASH markers on the chart where the ADL system is predicting prices to be into the future. We have determined that the $6500~6600 level of the NQ and the $2600~2650 level of the ES are key BASING target levels. From these levels, we expect the US majors to attempt a rally to recent highs first, pausing briefly, before breaking higher to attempt a fresh run at new highs.
This move should excite traders and investors. It means this recent volatility rotation provided a healthy “washout” of low volatility positions and the real price action can now begin in earnest. This is a classic setup for most technicians. A washout rotation setting up a potential double top pattern (acting like resistance) before a breakout move drives higher prices. All the while, setting up the short (with the double top formation) in a manner that will bait them into positions before the squeeze happens.
This move could be explosive and we are ready to help you understand the opportunities that exist in the markets now and for as long as you want our help. Just visit www.TheTechnicalTraders.com to learn how we can assist you. This type of research and our proprietary trading models will help you find successful trades and new opportunities. Our last trade generated a 42.5% return for our members in only 9 trading days.
Do you want to know what to expect over the next few weeks and months in the markets? We’re here to assist you. Pay attention to this move. Don’t get wrapped up in what might appear to be the beginning of a bigger downside move. There is a lot of fear still in the markets but our modeling systems are telling us the end result will be a breakout rally. Play it smart.
Become A Technical Trader With Us Today And Start Winning
Chris Vermeulen
www.TheTechnicalTraders.com
Chris Vermeulen has been involved in the markets since 1997 and is the founder of Technical Traders Ltd. He is an internationally recognized technical analyst, trader, and is the author of the book: 7 Steps to Win With Logic
Through years of research, trading and helping individual traders around the world. He learned that many traders have great trading ideas, but they lack one thing, they struggle to execute trades in a systematic way for consistent results. Chris helps educate traders with a three-hour video course that can change your trading results for the better.
His mission is to help his clients boost their trading performance while reducing market exposure and portfolio volatility.
He is a regular speaker on HoweStreet.com, and the FinancialSurvivorNetwork radio shows. Chris was also featured on the cover of AmalgaTrader Magazine, and contributes articles to several leading financial hubs like MarketOracle.co.uk
Disclaimer: Nothing in this report should be construed as a solicitation to buy or sell any securities mentioned. Technical Traders Ltd., its owners and the author of this report are not registered broker-dealers or financial advisors. Before investing in any securities, you should consult with your financial advisor and a registered broker-dealer. Never make an investment based solely on what you read in an online or printed report, including this report, especially if the investment involves a small, thinly-traded company that isn’t well known. Technical Traders Ltd. and the author of this report has been paid by Cardiff Energy Corp. In addition, the author owns shares of Cardiff Energy Corp. and would also benefit from volume and price appreciation of its stock. The information provided here within should not be construed as a financial analysis but rather as an advertisement. The author’s views and opinions regarding the companies featured in reports are his own views and are based on information that he has researched independently and has received, which the author assumes to be reliable. Technical Traders Ltd. and the author of this report do not guarantee the accuracy, completeness, or usefulness of any content of this report, nor its fitness for any particular purpose. Lastly, the author does not guarantee that any of the companies mentioned in the reports will perform as expected, and any comparisons made to other companies may not be valid or come into effect.
Chris Vermeulen Archive |
© 2005-2022 http://www.MarketOracle.co.uk - The Market Oracle is a FREE Daily Financial Markets Analysis & Forecasting online publication.