


Financial Tsunami Sweeps Across World Economies
Stock-Markets / Credit Crisis 2008 Sep 08, 2008 - 01:12 AM GMT

 Investors not only returned to a shortened trading week after the Labor Day holiday on Monday, but also to a bruising on stock markets, at least for those with long equity positions.
Concerns about the global economic outlook and continued financial duress spooked bourses around the world, with a number of other factors also adding to investors' nervousness. In particular, Pimco's Bill Gross, the manager of the world's largest bond fund, said the US needed to step up and buy assets to avoid a “financial tsunami” (Bill is renowned for talking his book on occasion!), Dwight Anderson's big Ospraie commodity hedge fund closed after suffering large losses, and Russia was selling foreign currency reserves to prop up the rouble after foreign capital fled the country following Russia's invasion of Georgia.
Stock markets and commodities ended the first week of a traditionally bad September deeply in the red, but government bonds and the greenback benefited from the deleveraging and a flight to perceived safety.
An announcement by the US Treasury Department regarding the bailing out and recapitalization of collapsing home mortgage giants Fannie Mae and Freddie Mac seems to be imminent. According to The Wall Street Journal , Congressman Barney Frank, chairman of the House Financial Services Committee, confirmed on Saturday that Treasury Secretary Henry Paulson was planning government intervention to back the troubled GSEs. The detail could be announced as early as today (Sunday), prior to the Asian markets reopening.

Source: Gary Varvel, Slate
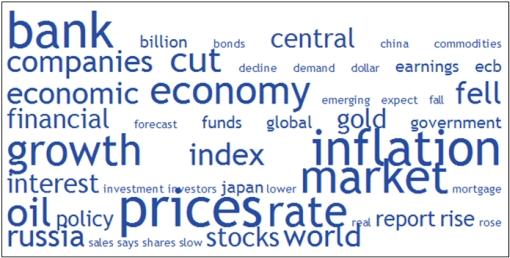
Next, a tag cloud of the text of all the articles I have read during the past week. This is a way of visualizing word frequencies at a glance. As expected, words such as “bank”, “prices”, “inflation” and “growth” featured prominently in my reading matter.
I have mentioned previously that the mid-July stock market lows need to be sustained in order for the summer rally and the market's base building to still be in effect. These levels – 10,963 for the Dow Jones Industrial Index and 1,215 for the S&P 500 Index – approached with unnerving speed last week.
Commenting on the current market weakness, Brett Steenbarger ( TraderFeed ) remarked as follows: “A number of sectors, such as consumer discretionary and even many of the financial shares, remain well above their July lows. It is not at all clear to me that this will be a fresh bear market leg down. I'm open to the idea that this may be an ultimately successful test of the July lows and part of a larger – and quite significant – bottoming process. Participation to the downside will tell the story.”
From across the pond, David Fuller ( Fullermoney ) added: “… investors have little incentive to channel the large capital pools accumulating in money-market funds back into stock markets. Resistance near the August highs for share indices has checked the rallies. Moreover, many have broken beneath their August lows this week. We have also seen some new lows for the year, reaffirming overall downward trends. Unless stock markets can push back above their August highs, the bear will remain in charge for a while longer.”

The last word goes to Richard Russell ( Dow Theory Letters) : “Yesterday's [Thursday's] stock market action, according to Lowry's, was a classic 90% downside day . Normally, such days are followed by 2 to 7 days of rally (bounce), and then a continuation of the downtrend. 90% downside days often come in a series of one or more, and after each 90% downside day we look (hope for) a 90% up-day. And that's where we are now.”
Before highlighting some thought-provoking news items and quotes from market commentators, let's briefly review the financial markets' movements on the basis of economic statistics and a performance round-up.
Economy
“Global business sentiment has been more or less consistent with a global economy that is near recession since the subprime financial shock hit over a year ago,” according to the Survey of Business Confidence of the World conducted by Moody's Economy.com . The survey did take on a slightly more upbeat tone at the end of August as pricing pressures abated a bit, sales strengthened somewhat and hiring firmed modestly. Businesses remain most dour in the US, Europe and Japan, and most upbeat in the rest of Asia.
In the US, the September Beige Book report from the 12 Federal Reserve districts indicated slow and weak conditions across nearly all districts. Price pressures for energy and commodities continued to be a factor during July and August across nearly all districts, although pass-through to wages appeared to be minimal, giving the Fed some breathing space in terms of monetary policy for now.
The most important economic data released in the US during the past week concerned the employment situation. Non-farm payroll employment fell by 84,000 in August and the unemployment rate rose to 6.1% from 5.7% in July. Revisions to June and July job numbers tacked on another 58,000 lost jobs. In the first eight months of 2008, on average 76,000 jobs have been lost each month. The decline in payrolls and the rise in the unemployment rate were both larger than expected by consensus forecasts, fueling concerns about the pace of consumer spending in the months ahead.
Summarizing the outlook for US interest rates, Asha Bangalore ( Northern Trust ) said: “The question is how long before it is widely acceptable to use the ‘R' word. The recent rally of the dollar and reduction in energy prices have allowed the Fed to watch and wait. That said, the Federal funds rate at 2.0% may have to be reconsidered in the near term if a turnaround is not visible. The September 16 FOMC meeting will most likely end with the Federal funds rate left unchanged at 2.0%.”

Hat tip: Phil's Stock World
Data releases from the UK, continental Europe and Japan underlined rapidly worsening economies bordering on recession.
The European Central Bank (ECB) kept its main refinance rate on hold at 4.25% at its September monetary policy meeting. Interest rates are at a seven-year high as central bankers are unwilling to relax monetary policy before inflation comes down closer to the bank's 2% target.
In line with market expectations, the Bank of England (BoE) decided to keep its key repo rate steady at 5% at its September monetary policy meeting. September marks the fifth consecutive month with no change in the monetary policy rate.
Week's economic reports
Click here for the week's economy in pictures, courtesy of Jake of EconomPic Data . This is an exciting addition to “Words from the Wise” and will in future be included regularly.
Date |
Time (ET) |
Statistic |
For |
Actual |
Briefing Forecast |
Market Expects |
Prior |
| Sep 2 | 12:00 AM | Auto Sales | Aug | - | 4.8M | NA | 4.4M |
| Sep 2 | 12:00 AM | Truck Sales | Aug | - | 4.8M | NA | 4.6M |
| Sep 2 | 10:00 AM | Construction Spending | Jul | -0.6% | -0.3% | -0.4% | 0.3% |
| Sep 2 | 10:00 AM | ISM Index | Aug | 49.9 | 50.2 | 50.0 | 50.0 |
| Sep 3 | 12:00 AM | Auto Sales | Aug | - | 4.8M | NA | 4.4M |
| Sep 3 | 12:00 AM | Truck Sales | Aug | - | 4.8M | NA | 4.6M |
| Sep 3 | 8:15 AM | ADP Employment | Aug | - | - | -19K | 9K |
| Sep 3 | 10:00 AM | Factory Orders | Jul | 1.3% | 1.0% | 1.0% | 2.1% |
| Sep 3 | 10:35 AM | Crude Inventories | 08/30 | - | NA | NA | -177K |
| Sep 3 | 2:00 PM | Fed's Beige Book | - | - | - | - | - |
| Sep 4 | 8:15 AM | ADP Employment | Aug | -33K | - | -30K | 1K |
| Sep 4 | 8:30 AM | Initial Claims | 08/30 | 444K | 415K | 420K | 429K |
| Sep 4 | 8:30 AM | Productivity Rev. | Q2 | 4.3% | 3.5% | 3.5% | 2.2% |
| Sep 4 | 10:00 AM | ISM Services | Aug | 50.6 | 50.0 | 49.5 | 49.5 |
| Sep 4 | 10:35 AM | Crude Inventories | 08/30 | -1898K | NA | NA | -177K |
| Sep 5 | 8:30 AM | Average Workweek | Aug | 33.7 | 33.7 | 33.6 | 33.7 |
| Sep 5 | 8:30 AM | Hourly Earnings | Aug | 0.4% | 0.3% | 0.3% | 0.4% |
| Sep 5 | 8:30 AM | Non-farm Payrolls | Aug | -84K | -70K | -75K | -60K |
| Sep 5 | 8:30 AM | Unemployment Rate | Aug | 6.1% | 5.7% | 5.7% | 5.7% |
Source: Yahoo Finance , September 5, 2008.
Next week's US economic highlights, courtesy of Northern Trust , include the following:
1. International Trade (September 11): The trade deficit is predicted to have widened to $58.5 billion in July from $56.8 billion in June, partly accounting for higher imported oil prices. Consensus : $59.5billion.
2. Retail Sales (September 12): Auto sales rose to 13.7 million units in August from 12.55 million in July. Gasoline prices are likely fell in August. The headline may show a small gain (+0.2%) to reflect the jump in car sales. Excluding autos, retail sales should be soft. Consensus : 0.3% versus -0.1% in July; non-auto retail sales: -0.2% versus 0.4% in July.
3. Producer Price Index (September 12): The Producer Price Index for finished goods is expected to have dropped 0.6% in August, reflecting lower energy prices. The PPI was up 1.2% in July. The core PPI is most likely to have risen by 0.1% after a 0.7% increase in July. Consensus : +0.4%, core PPI +0.2%.
4. Other reports : NFIB survey, Pending Home Sales Index (September 9), Import Prices (September 11], Inventories, Consumer Sentiment Index (September 12).
Click here for a summary of Wachovia's weekly economic and financial commentary.
A summary of the release dates of economic reports in the UK, Eurozone, Japan and China is provided here . It is important to keep an eye on growth trends in these economies for clues on, among others, the trend of the US dollar.
Markets
The performance chart obtained from the Wall Street Journal Online shows how different global markets performed during the past week.
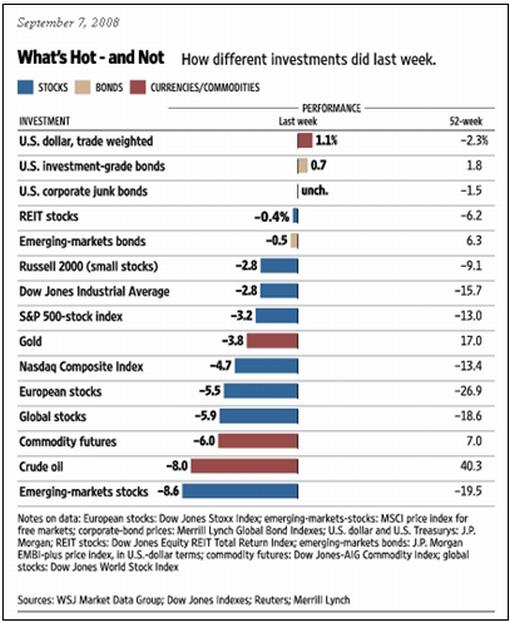
Source: Wall Street Journal Online , September 7, 2008.
Equities
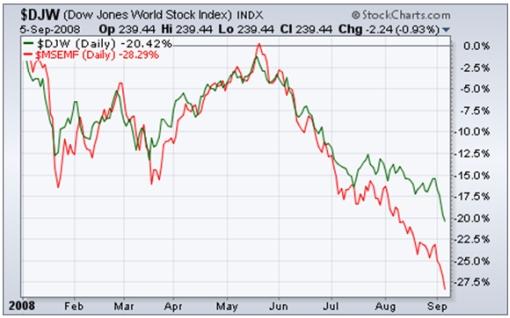
Stock markets around the world suffered badly during the past week on the back of the deteriorating global economic outlook, with the MSCI World Index and the MSCI Emerging Markets Index plunging by 5.6% and 8.6% respectively.
Among mature markets, the worst losses were recorded by the UK FTSE 100 (-7.0%), the Canadian S&P/TSX Composite Index (-6.9%), the Japanese Nikkei 225 Average (-6.6%) and the French CAC 40 Index (-6.4%).
The carnage among emerging markets was even worse as illustrated by the declines in markets such as Russia (-10.8%), Taiwan (-10.5%), South Africa (-8.3%) and China ( 8.1%). Gains were few and far between, with Pakistan (+1.5%) and the Philippines (+1.4%) being two of the rare positive spots.
With the exception of the Nasdaq Composite Index (-4.7%; YTD -14.9%), the US stock markets fell by somewhat less than most other bourses as shown by the major index movements: Dow Jones -2.8%% (YTD -15.4%), S&P 500 Index -3.2% (YTD -15.4%) and Russell 2000 Index -2.8% (YTD 6.2%).
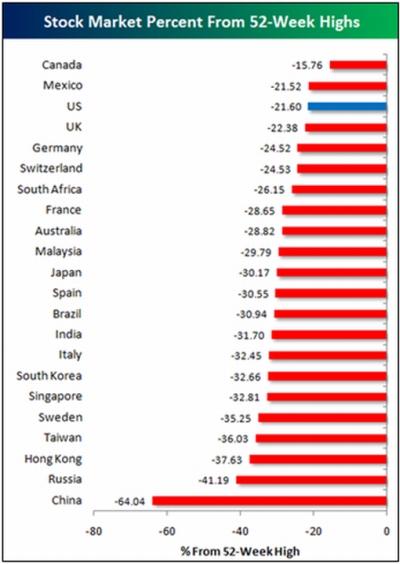
Factoring in the past week's performance, an interesting picture regarding bear market declines emerged, as summarized by Bespoke : “After declining 4.25% on Wednesday, 3.94% yesterday, and 3.75% today, Russia's RTS Index is now 41.19% below its 52-week high. These declines put it second to last behind China when looking at recent equity market returns for 22 major countries. As shown, China has fallen 64% from its 52-week high last October!
“The declines recently in global equity markets have really been astounding. Japan, Spain, Brazil, India, Italy, South Korea, Singapore, Sweden, Taiwan, and Hong Kong all join China and Russia with equity markets off at least 30% from their 52-week highs. North American countries rank 1, 2, 3 as countries holding up the best. International exposure has never hurt so bad.”
The past week's sell-off has resulted in all the major US indices trading below their respective 50- and 200-day moving averages, with the exception of the Russell 2000 Index which is still marginally above the 200-day line. Some comfort for the bulls is that the key mid-July lows have not yet been breached by any of the indices.
Click here or on the thumbnail below for a market map, courtesy of Finviz.com , providing a quick overview of the performance of the various segments of the S&P 500 Index over the week.
The major trend in the market last week was a sell-off in many commodity-related groups – oil and gas, gold, aluminum, steel, coal and copper. The drivers of these declines were lower commodity prices and growing investor concern over a global economic slowdown. The diversified metals and mining group was the worst-performing group for the week, declining by 17%. Its single member, Freeport-McMoran (FCX), sold off as the prices of copper and gold declined.
The construction and engineering group (-16%) was the second-worst performer, negatively impacted by economic woes and the fact that many companies in this group have exposure to energy commodity prices.
The regional bank group (+7%) was the best-performing group for the week. As oil and other commodity-related groups declined, there was an apparent rotation into several financial groups, including regional banks.
The home improvement retail group also outperformed, rising by 5%. The group was led higher by its two largest members, Home Depot (HD) and Lowe's Companies (LOW). An analyst report said that economic forces weighing on home improvement chains were nearing the end of their “trough-like levels” and the early stages of improvement could begin sometime next year.
Fixed-interest instruments
Increasing risk aversion and a flight to safety pushed global government bond yields sharply lower during the past week.
The ten-year US Treasury Note declined by 18 basis points to 3.65%, the UK ten-year Gilt yield by 10 basis points to 4.38% and the German ten-year Bund yield by 14 basis points to 4.03%.
Bond yields are increasingly taking their cue from investors' worries about a global economic recession, whereas the threat of inflation is subsiding as shown by the declining trend since March in the Lehman US Treasury Inflation Protected Securities ETF (TIP).
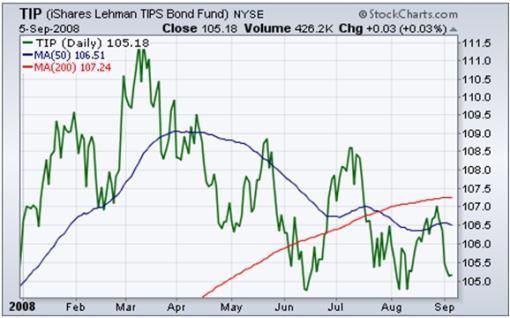
Emphasizing the importance of the direction of bonds, Richard Russell ( Dow Theory Letters ) said: “… I'm watching the bond action intently. If the bonds believe ‘things are getting better', they'll head down. If bond investors continue to be worried about the outlook, they'll buy the currently low-yielding Treasuries, with 10-year notes now yielding only 3.66%.”
Currencies
The US dollar maintained its upward path during the past week, supported by the view that interest rate differentials may increasingly favor the greenback as data from the UK, continental Europe and Japan are weakening relative to the US.
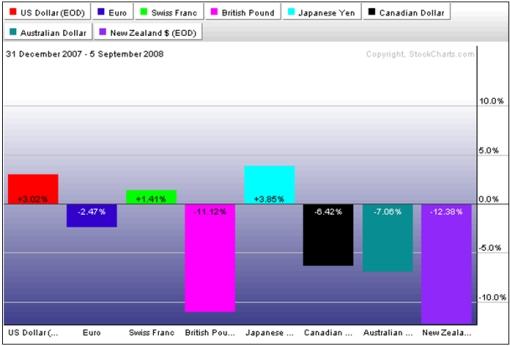
The past week saw the US dollar rising against the euro (+3.2% – an eleven-month high), the British pound (+3.6%), the Swiss franc (+1.7%), the Australian dollar (+1.2%) and the Canadian dollar (+0.5%).
However, the US currency declined by 1.9% against the Japanese yen as risk aversion triggered the unwinding of carry trade transactions funded by the low-yielding yen.
The currencies of commodities producers came under strong selling pressure as commodities slipped further. Examples include the Australian and New Zealand dollars that declined by 5.5% and 4.9% respectively against their US counterpart. The Aussie dollar was also weakened by the Reserve Bank of Australia lowering its key interest rate by 25 basis points to 7.0% – the first cut in seven years.
The histogram below shows the performance of a number of currencies since the beginning of 2008, indicating the US currency is now in positive territory after a gain of 3.0% YTD.
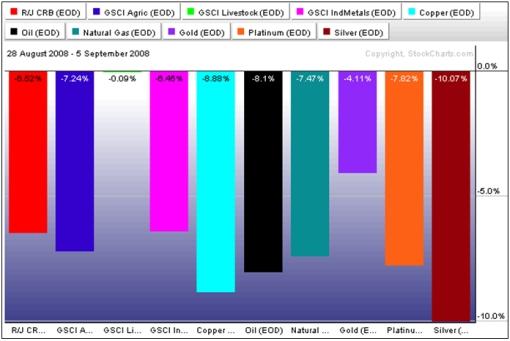
Commodities
The continued unwinding of commodity positions savaged the Reuters/Jeffries CRB Index, shown by the week's 6.5% plunge. 22.4% of the Index's value has been wiped out since its record peak of July 2 – just more than two months ago.
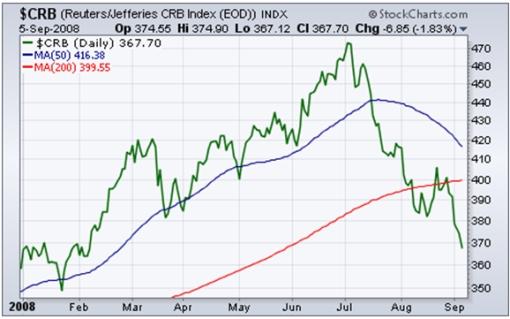
Regarding the outlook for crude oil, David Fuller ( Fullermoney ) said: “Today, I see no evidence that crude oil has bottomed in what I regard as a lengthy medium-term correction, meaning a minimum of several months and up to two or possibly even three years. … we could easily see a retest of $100 this year, with an outside chance of a temporary overshoot, taking us close to $80.”
The chart below shows the damage of the past week's movements for various commodities:
Now for a few news items and some words and charts from the investment wise that will hopefully assist with navigating our portfolios through the treacherous investment waters. But always remember Earl Nightingale's words: “Wherever there is danger, there lurks opportunity; whenever there is opportunity, there lurks danger. The two are inseparable. They go together.” (Hat tip: The Kirk Report .)

Source: McClatchy
The New York Times: US rescue seen at hand for two mortgage giants
“Senior officials from the Bush administration and the Federal Reserve on Friday called in top executives of Fannie Mae and Freddie Mac, the mortgage finance giants, and told them that the government was preparing to place the two companies under federal control, officials and company executives briefed on the discussions said.
“The plan, which would place the companies into a conservatorship, was outlined in separate meetings with the chief executives at the office of the companies' new regulator. The executives were told that, under the plan, they and their boards would be replaced and shareholders would be virtually wiped out, but that the companies would be able to continue functioning with the government generally standing behind their debt, people briefed on the discussions said.
“It is not possible to calculate the cost of any government bailout, but the huge potential liabilities of the companies could cost taxpayers tens of billions of dollars and make any rescue among the largest in the nation's history.
“Under a conservatorship, the common and preferred shares of Fannie and Freddie would be reduced to little or nothing, and any losses on mortgages they own or guarantee could be paid by taxpayers. Shareholders have already lost billions of dollars as the stocks have plunged more than 80 percent this year.
“A conservatorship would operate much like a pre-packaged bankruptcy, similar to what smaller companies use to clean up their books and then emerge with stronger balance sheets. It would allow for uninterrupted operation of the companies, crucial players in the diminished mortgage market, where they are now responsible for nearly 70 percent of new loans.
“The executives were told that the government had been planning to announce the decision as early as Sunday, before the Asian markets reopen, the officials said.”
Source: Stephen Labaton and Andrew Ross Sorkin, The New York Times , September 6, 2008.
Bloomberg: Volcker says finance system “broken”, losses may rise
“Former Federal Reserve Chairman Paul Volcker said the US financial system, dependent upon securitization rather than traditional bank loans, is broken, and may contribute to the weakest expansion since the 1930s.
“‘This bright new system, this practice in the United States, this practice in the United Kingdom and elsewhere, has broken down,' Volcker said today at a banking conference in Calgary. ‘Growth in the economy in this decade will be the slowest of any decade since the Great Depression, right in the middle of all this financial innovation.'
“The former Fed chief projected ‘a lot' more losses from the collapse in the mortgage-backed debt market, after the more than $500 billion tallied so far, should the US, European and Japanese economies fail to pick up. He urged changes in financial regulations, echoing calls among sitting officials and legislators.
“‘It is the most complicated financial crisis I have ever experienced, and I have experienced a few,' said Volcker.
“‘Changes are going to have to be made' to the global financial system, Volcker said. Banks three decades ago accounted for about 60% of US credit; that later declined to about 30% as securitization – where financial firms package assets into bonds and other instruments and sell them on to investors and other companies – spread.”
Source: Doug Alexander and Steve Matthews, Bloomberg , September 5, 2008.
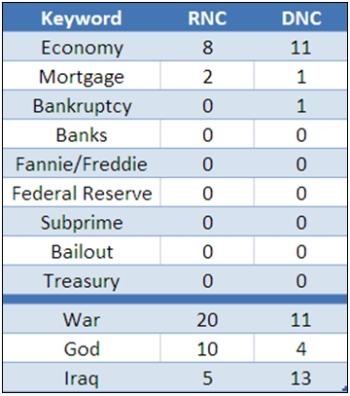
Paul Kedrosky (Infectious Greed): RNC/DNC: Crisis? What crisis?
“What continues to amaze me is the not-so-benign neglect being accorded by politicians to the current financial crisis in the US. Granted, it's usually better being ignored by such people; and granted, the current debacle is more complicated than saying ‘Ken Lay is a bad man'. But if you had watched the just-completed Democratic and Republican National Conventions, you wouldn't have known the US is stumbling through the worst financial crisis since the Great Depression. Nor would you have known, of course, that we're queuing up for a bill that could exceed total Iraq War expenditures.
“To prove the point to my own satisfaction, I combined the Palin/McCain acceptance speeches in one block of text, and the Obama/Biden speeches in another. I then set up some keywords to compare across the text blocks. The following summary table shows keywords in the left column, and then respective keywords counts for each party' slate in the appropriate DNC or RNC column. This isn't the usual exercise in cute tag clouds, but an attempt to understand whether important language concerning the current financial crisis penetrated the political radar over the last few weeks.
“And it hasn't – unless, of course, the repeated utterance of the word ‘God' came in a context more like ‘Oh God, we're screwed!' than I think it did.”
Source: Paul Kedrosky, Infectious Greed , September 6, 2008.
Asha Bangalore (Northern Trust): Employment situation confirms recession is underway
“Civilian Unemployment Rate: 6.1% in August vs. 5.7% in July; cycle low is 4.4% in March 2007
Payroll Employment: -84,000 in July vs. -60,000 in July, net loss of 58,000 jobs after revisions of payroll estimates for June and July.
Hourly earnings: +7 cents to $18.14, 3.6% yoy change vs. 3.4% yoy change in July; cycle high is 4.28% yoy change in Dec. 2006.
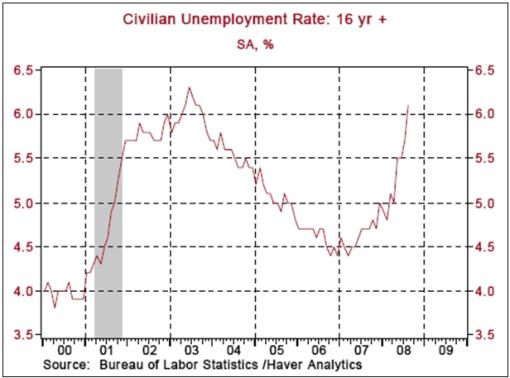
“The jobless rate has risen 1.3 percentage points in a six-month span. Similar gains in a short time period last occurred in the 1982-82 recession. The recessions of 1990-91 and 2001 registered smaller increases in a six-month period. The question is how long before it is widely acceptable to use the ‘R' word?
“At first blush, a sharp increase in the unemployment rate points to the possibility/necessity of a lower federal funds rate. However, the unemployment rate is a lagging indicator and historically a large part of easing of monetary policy is done prior to the establishment of a peak for the jobless rate, which the current FOMC has carried out between September 2007 and April 2008 by lowering the federal funds rate 375 bps. The complete lagged impact of this action will be evident by year-end.
“The recent rally of the dollar and reduction in energy prices have allowed the Fed to watch and wait. That said, the federal funds rate at 2.00% may have to be reconsidered in the near term if a turnaround is not visible. The September 16 FOMC meeting will most likely end with the federal funds rate left unchanged at 2.00%.”
Source: Asha Bangalore, Northern Trust – Daily Global Commentary , September 5, 2008.
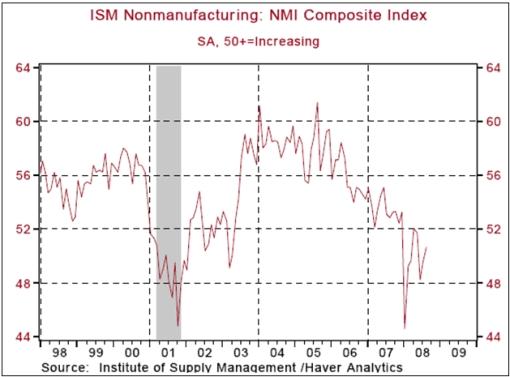
Asha Bangalore (Northern Trust): ISM non-manufacturing survey –export orders drop to cycle low
“The ISM Non-Manufacturing Survey results for August show a small improvement in the composite index. In August, the index moved up to 50.6 from 48.5 in July. The largest positive contribution was from supplier deliveries (55.5 vs. 53.5 in July). The new orders index (49.7 vs. 47.9 in July) and the employment index (45.5 vs. 47.1 in July) remain below 50.0, while the business activity index (51.6 vs. 49.6 in July) rose above 50.0. Readings above 50.0 denote an expansion in activity.”
Source: Asha Bangalore, Northern Trust – Daily Global Commentary , September 4, 2008.
Asha Bangalore (Northern Trust): ISM manufacturing index – factory sector in slump
“The ISM manufacturing composite index has moved between 50.7 and 48.4 since September 2007. During the twelve months ended August 2008, this index posted readings above 50.0 for six months, ranging between a high of 50.7 in January 2008 and a low of 50.0 in October 2007 and July 2008. During the six months in which it held below 50.0, it has hovered between 48.4 and 49.9. In other words, the composite index suggests that the factory sector has been moving around insignificant growth and contraction for a period of twelve months. The composite index for August is 49.9.”
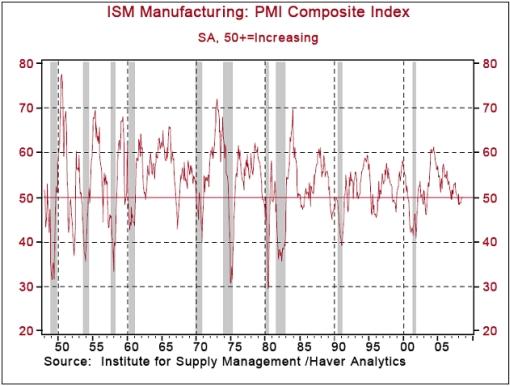
Source: Asha Bangalore, Northern Trust – Daily Global Commentary , September 2, 2008.
Bespoke: Mortgage rates show decline
“A couple of weeks ago, credit crisis watchers were focused on rapidly rising 30-year fixed mortgage rates as well as the spiking cost to insure against corporate debt default. As shown in the charts below, default risk still remains extremely elevated, but at least the 30-year fixed mortgage rate has come down from the 6.5% level to about 6.2% over the last few weeks.”
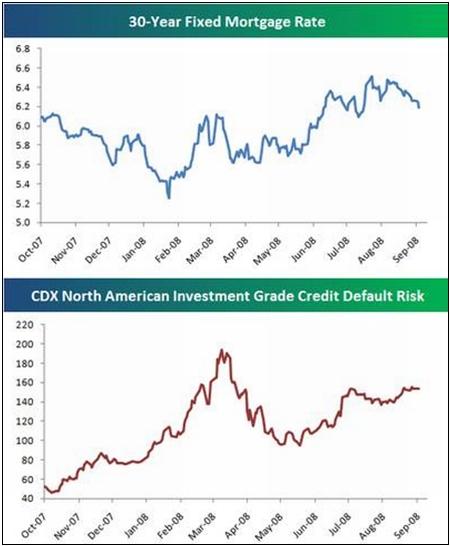
Source: Bespoke : September 4, 2008.
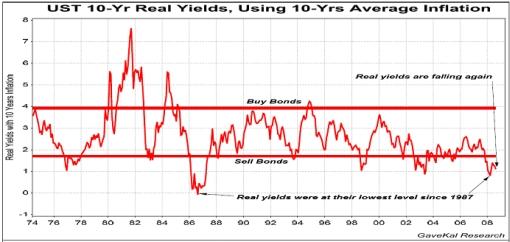
GaveKal: Ten-year US bond yields too low
“In recent weeks, we have seen 10-year bond yields in the US grind lower every day, to reach the current 3.7%, i.e. a level last seen in the midst of the Bear Stearns implosion. Meanwhile, real rates have now plumbed depths that we have never witnessed in our career. And interestingly, this pullback in bond yields has occurred while most of the US economic data actually surprised on the upside (i.e. yesterday's US factory orders that came out better than expected). So why are bond yields pulling back when, increasingly, the US recession looks like The Recession That Never Was?
“1) The first possible explanation is that, with the US$ strengthening and commodities pulling back, the Fed will be under a lot less pressure to raise interest rates anytime soon. In turn, this probably gives US commercial banks more confidence to borrow at the short end to lend at the long end, making the most out of the steep US yield curve.
2) The second possible explanation is that we are of course in the midst of a financial panic with tremendous volatility across all asset classes (commodities, real estate, corporate bonds, equities and foreign exchange). At such times, the natural inclination of investors is to seek refuge in government bonds.
3) The third possible explanation is that most market participants are coming around to the view that inflation will not wreak as much havoc as some feared just a few months ago. Instead, the risk remains one of lackluster economic growth (though we have to wonder how high that risk is for the US given the steepness of the yield curve and the record low real rates).
4) Finally, the last possible explanation is that we are currently going through a sea-change in the investment environment. Instead of an environment of a continuously falling US$, which favors emerging markets, commodities and increasing leverage, we are now in an environment of a rising US$ and thus a lot of the trends that we have experienced in recent years are reversing. As this happens, and the outlook becomes more uncertain, investors are probably seeking refuge in the shelter of US Treasuries.
“Nevertheless, with yields at 3.7% it seems to us that US Treasuries are increasingly becoming a ‘limited upside and large possible downside' asset class. As the new investment environment unfolds, and as investors realize that, outside of financials and materials/energy, the rest of the OECD equity markets are holding up decently, we would expect equities to once again start outperforming bonds, and this especially in the US and in Japan.”
Source: GaveKal – Checking the Boxes , September 4, 2008.
Did you enjoy this post? If so, click here to subscribe to updates to Investment Postcards from Cape Town by e-mail.
By Dr Prieur du Plessis
Dr Prieur du Plessis is an investment professional with 25 years' experience in investment research and portfolio management.
More than 1200 of his articles on investment-related topics have been published in various regular newspaper, journal and Internet columns (including his blog, Investment Postcards from Cape Town : www.investmentpostcards.com ). He has also published a book, Financial Basics: Investment.
Prieur is chairman and principal shareholder of South African-based Plexus Asset Management , which he founded in 1995. The group conducts investment management, investment consulting, private equity and real estate activities in South Africa and other African countries.
Plexus is the South African partner of John Mauldin , Dallas-based author of the popular Thoughts from the Frontline newsletter, and also has an exclusive licensing agreement with California-based Research Affiliates for managing and distributing its enhanced Fundamental Index™ methodology in the Pan-African area.
Prieur is 53 years old and live with his wife, television producer and presenter Isabel Verwey, and two children in Cape Town , South Africa . His leisure activities include long-distance running, traveling, reading and motor-cycling.
Copyright © 2008 by Prieur du Plessis - All rights reserved.
Disclaimer: The above is a matter of opinion and is not intended as investment advice. Information and analysis above are derived from sources and utilizing methods believed reliable, but we cannot accept responsibility for any trading losses you may incur as a result of this analysis. Do your own due diligence.
Prieur du Plessis Archive |
© 2005-2022 http://www.MarketOracle.co.uk - The Market Oracle is a FREE Daily Financial Markets Analysis & Forecasting online publication.