Stock Market High Volatility, Higher inflation, low unemployment
Stock-Markets / Stock Markets 2018 Mar 01, 2018 - 02:29 PM GMTBy: Abalgorithm
 Unemployment in the last year has sunk to a 17-year low, yet inflation continues to run below the Fed’s 2% target. Abroad, it is the same story: in Germany and Japan unemployment is at multidecade lows but inflation remains stuck below 2%. We are in a new normal of low reported unemployment and low inflation across the world. However if history is a gauge of what is to come, we are headed into a different normal, one that will spell trouble for all those who have reposed blind faith in risk markets without due diligence. Volatility has broken into a new normal range of 18 to 35. Bond yields are flirting at 2.9% from 2.6% earlier last year. A new normal in yields around the world. Bond investors are fleeing. The equity markets have had a damaging correction in Feb. It has dead cat bounced back but most smart traders will be exiting their long positions. This may be the final chance. We look at some key indicators to see where we stand and what the future may hold.
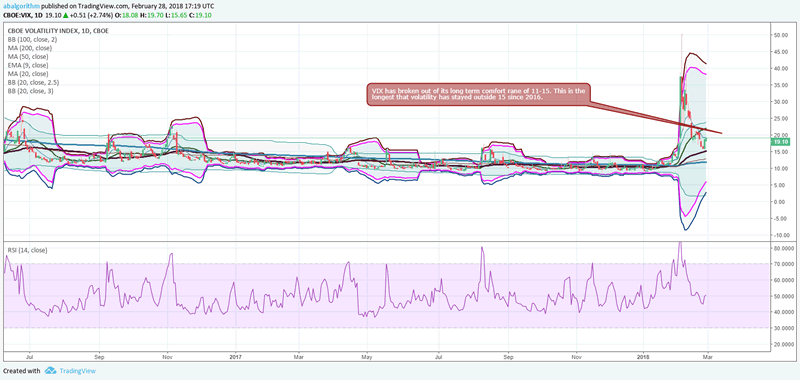
VIX has broken out of its long term comfort range of 11-15. This is the longest that volatility has stayed outside 15 since 2016.
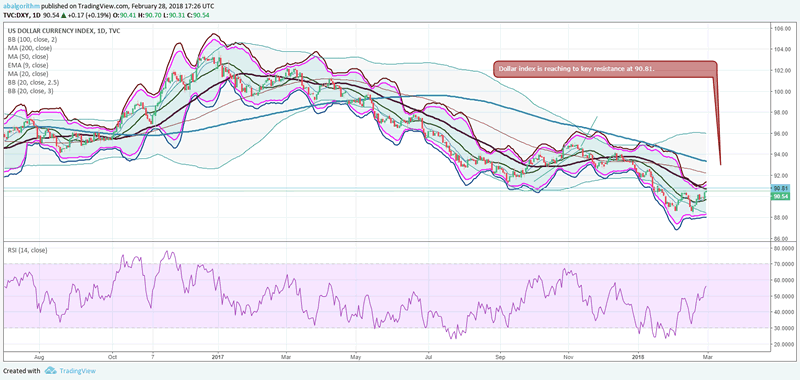
The dollar index has raced higher to 90.81 after hitting major support at 88.5 levels. The way it reacts at 90.8 will decide the future of risk markets. If we see a continued strengthening, we could see equity indices crack and take the Feb lows with it.

S&P index has taken out all stops above 2740 and moved near 2780. But there is no followup. This is clearly confirming tha the bull run of 2015,2016 and 2017 is over!!1
One of the major headwinds facing financial markets is the quick rise in inflation amidst political uncertainty. FED is perfectly capable of holding off inflation as it has done over the last 5 years. However when meddled by politicians, we are entering the era of 1968 to 1981 super inflationzone when FED was late to control inflation as two of the most inept central bankers allowed themselves to be manipulated by politicians. In 1966, inflation, which had run below 2% for nearly a decade, suddenly accelerated to over 3%. Some of the circumstances echo the present: unemployment had slid to 4%, taxes had been cut and federal spending for the Vietnam War and Lyndon Johnson’s “Great Society” programs was surging. Deutsche Bank economists note the budget deficit jumped by more than 2% of gross domestic product between 1965 and 1968, similar to what they project between 2016 and 2019. Except in recessions, stimulus of this size “is unprecedented outside of these two episodes,” they said. The effect of an overheating economy was then compounded by policy errors. Fed chairmen William McChesney Martin Jr. and Arthur Burns were too optimistic about how low unemployment could go without pushing prices higher, and succumbed to pressure from Johnson and then Richard Nixon to keep interest rates low. From 1966 to 1981, inflation and interest rates climbed to double digits, decimating stock and bond values.
Some on Wall Street worry Mr. Trump, who treats the stock market as a report card on his presidency, will similarly pressure Mr. Powell. So far, this seems unlikely: Mr. Trump and his officials have asserted the Fed’s independence and no central banker, Mr. Powell included, wants to be remembered as another Arthur Burns.
While bond market yields are still below the 3% levels, we believe it will move above at some point during this year. This is why the VIX index has now moved above 15x mark. Market is now inherently demanding a higher risk premia for abnormal market events in the future which we read as uncontrolled inflation.
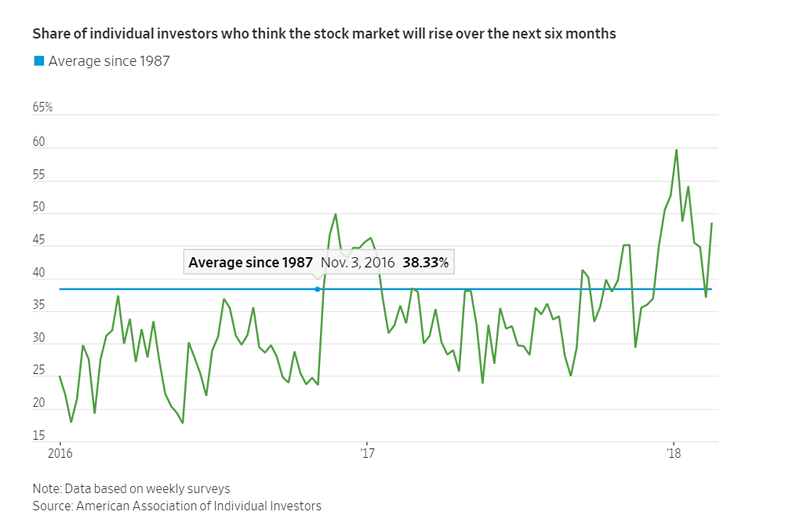
As inflation rears its head quietly and steadily, bond and stock returns will both go down together. Even as we grow pessimistic on stock returns, the euphoria on the street has surpassed the levels seen in 2007. Even normal people are not afraid when stocks decline 10% because they have seen that all declines recover. One day it will not....and it will keep falling. We at abalgorithm are posing ourselves to see confirmation of a bearish trend in stocks. We believe the next great trade will be shorting US equity markets. The time for that is approaching though we are yet to see confirmation. Stay subscribed and you will know when trade.
USDJPY: A clear warning
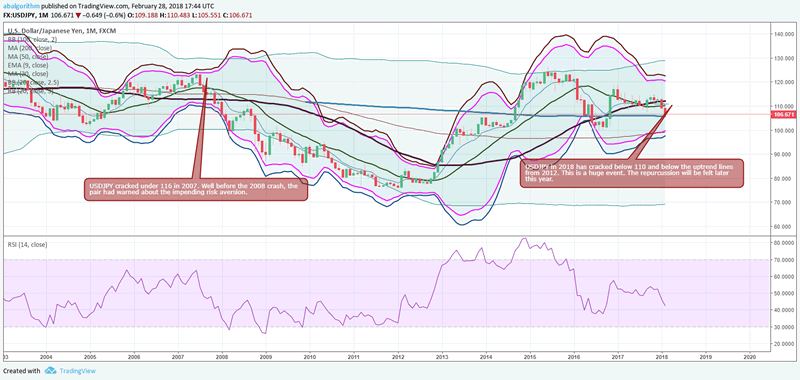
USDJPY has moved below the key uptrend line from 2012. This crack below 110 is a clear warning that smart money has started to flow out of risk markets. Spot forex moves far before any other market. In 2007, USDJPY moved below 116. However it was many months later that the S&P finally cracked and hit new lows at 666. Be smart and be warned. As markets give a few more months of quiet period, it is time to be smart and move money out of a overheated equity market.
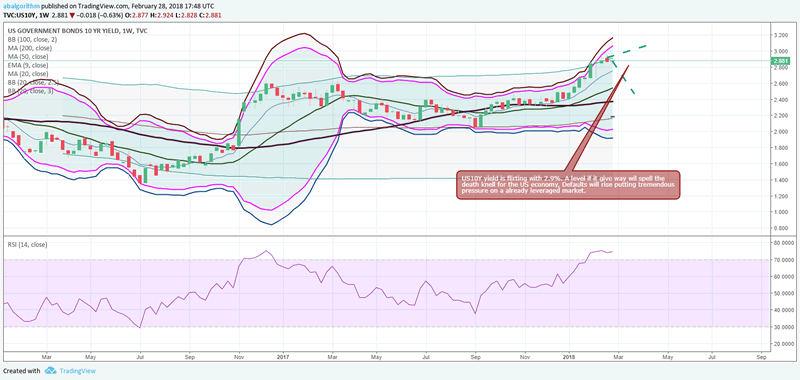
US10Y yield is flirting with 2.9%. A level if it give way will spell the death knell for the US economy, Defaults will rise putting tremendous pressure on an already leveraged market.
If you would like to become a Premium member, please visit membership
Our trade copier has been accumulating returns for clients in February. The month added +15% to client capital. The model traded over 20 forex pairs to make these returns.
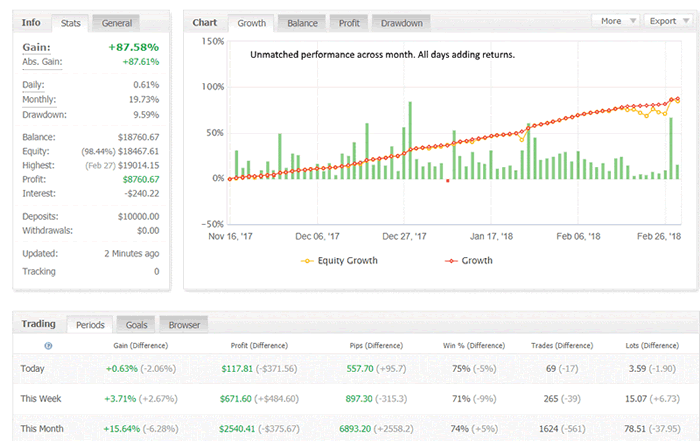
The equity returns overall has increased to 87.5%. The win rate has been 72%. One of the most profitable trading systems for retail investors. To join the trade copier with a MT4 live account, please reach out to support@abalgorithm.com OR fill the form.
We also have a manual trading membership which allows clients to read our premium trade analysis and they can trade on their own. Please select the PRO package OR PRO GOLD package in membership here.
About Abalgorithm.com
Abalgorithm operates an automated quant forex trade copier and a live trade room for clients who trade forex. We also provide daily research on equities, bonds, ETF, commodities. We are located at http://abalgorithm.com
© 2018 Copyright Abalgorithm - All Rights Reserved Disclaimer: The above is a matter of opinion provided for general information purposes only and is not intended as investment advice. Information and analysis above are derived from sources and utilising methods believed to be reliable, but we cannot accept responsibility for any losses you may incur as a result of this analysis. Individuals should consult with their personal financial advisors.
© 2005-2022 http://www.MarketOracle.co.uk - The Market Oracle is a FREE Daily Financial Markets Analysis & Forecasting online publication.


