SILVER Large Specualtors Net Short Position 15 Year Anniversary
Commodities / Gold and Silver 2018 Mar 05, 2018 - 09:16 AM GMTBy: Clive_Maund
 Technical analyst Clive Maund charts silver and explains why he is bullish on the metal.
The purpose of this update is to commemorate the Large Specs having their first net short position in silver since the site started 15 years ago, and also to consider how we can turn this to our advantage. Before we look at silver's latest extraordinary COT chart and consider its implications, we will first quickly review the silver charts.
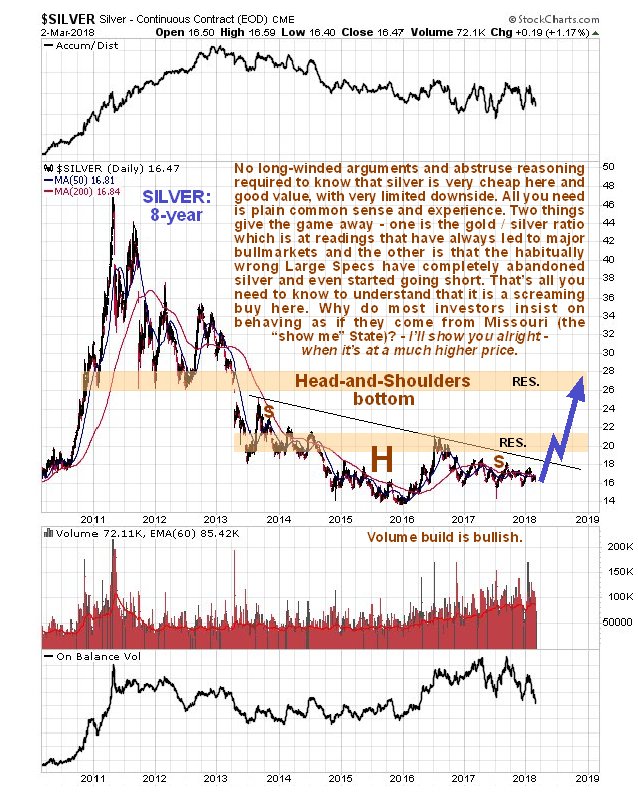
We will start with an 8-year chart that shows the big picture and includes the entire bear market from the April–May 2011 peak. On this chart we see that silver is in the very late stage of a giant downsloping Head-and-Shoulders bottom and currently grinding sideways marking out a protracted Right Shoulder low. Because of its downslope, many observers think that silver's bear market is ongoing and fail to spot that this is a giant base pattern, but the parallel Head-and-Shoulders bottom in gold is much more obvious because it is flat-topped, and it is this that helps give the game away.
Also because of the downslope, silver is viewed by many as being less attractive than gold, but it is normal for silver to underperform gold towards the end of a sector bear market and into the early stages of a bull market. This results in silver and silver related investments becoming grossly undervalued and neglected, and creates the conditions for a powerful rally that appears seemingly "out of the blue." One bullish factor that seems to have escaped the notice of many observers is that volume has been building steadily for many months, which is sign of increasing distress selling by frustrated longtime holders of silver, but since the price is no longer dropping it is clear that Smart Money is mopping up their offerings at an increasing rate too. While breakout from the base pattern will be signaled by a break clear above its downsloping "neckline" silver probably won't really get moving until it breaks above the 1st band of resistance shown.
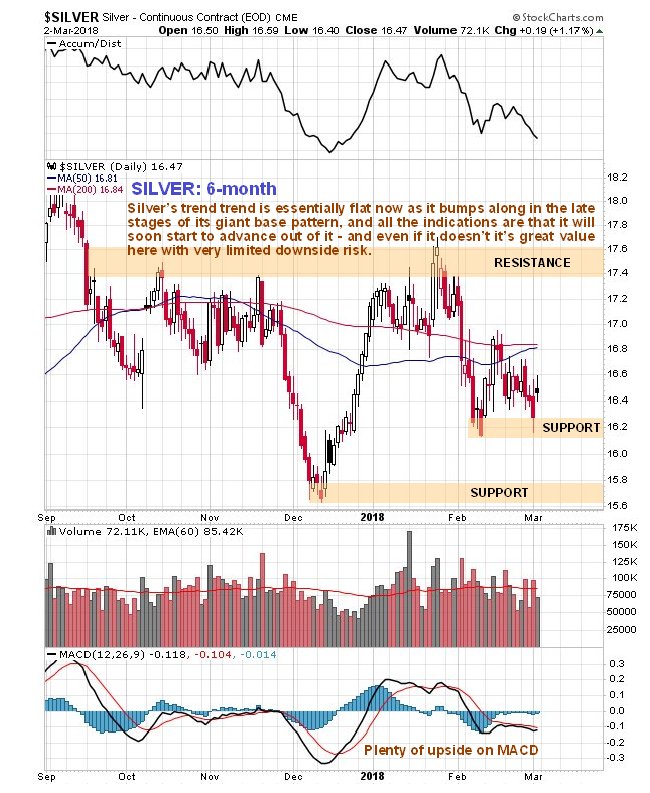
The shorter-term 6-month chart shows us recent action in much more detail. While this chart is of limited use technically, it does show us that the price and moving averages are now very closely bunched together, a frequent precondition for a big rally, although this same moving average bunching occurred back in October, but that led to a break lower instead, however, at that time the COTs were not bullish at all as they are now. At this point silver is less than $3 above its bear market lows in late 2015 just below $14, so it is currently very cheap and good value.
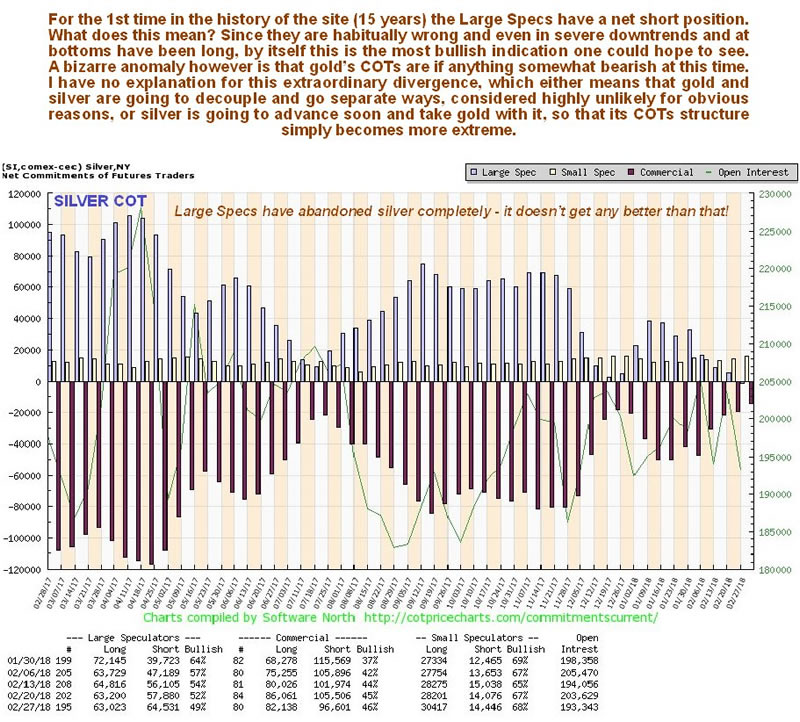
Now we come to the main focus of this article, which is to highlight silver's latest COT, that is viewed as being extraordinarily bullish. You gotta love the Large Specs—they have a time honored tradition of being a very reliable contrary indicator, and with silver they have been and are making a special effort to uphold this tradition, and on this occasion they are "going the extra mile" by relinquishing their long positions completely so that true contrarians like us can zoom in and scoop up silver and silver related investments at rock bottom prices. The protracted year-long Right Shoulder low of the H&S bottom has ground them into the dust and they have finally given up and thrown in the towel. The setup could not be more bullish, especially considering the current silver/gold ratio.
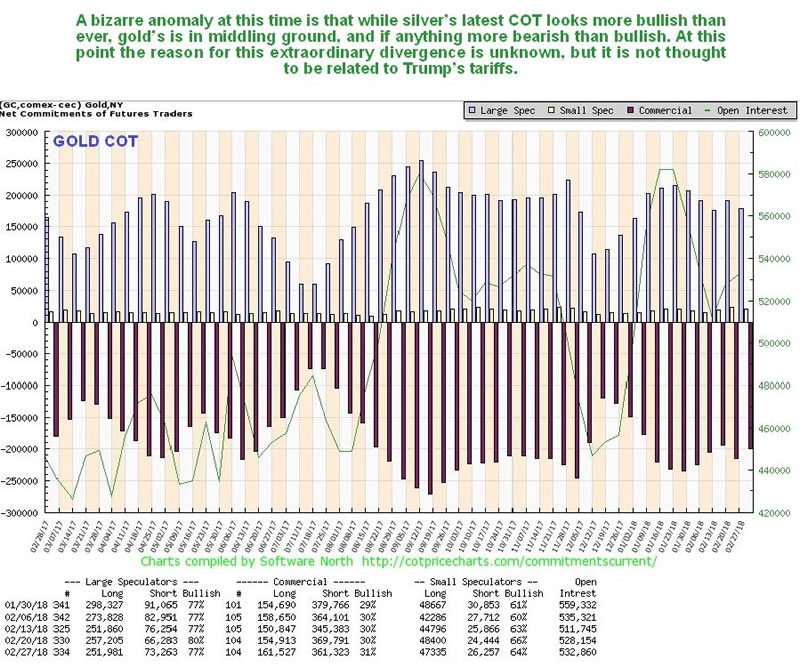
One somewhat troubling anomaly that we have had to contend with is that gold's COT is nowhere near as bullish as silver's, in fact it is not bullish at all and if anything is verging on bearish. This rather bizarre situation that has not been seen before, at least not to this extent, suggests one of two possible outcomes—either gold and silver are going to decouple and go their separate ways, which is viewed as almost impossible that they are both extracted from the same ore, or silver is going to advance and take gold along for the ride, so that gold's COT structure simply becomes more extreme.
The key point to key in mind regarding this is that the combination of a very positive silver/gold ratio and an exceptionally bullish silver COT means that silver is not going down, or if it does drop it will be by a trivial amount, while the upside potential is now very big.
The latest silver Hedgers chart, while not at record bullish extremes yet, is not far off them.
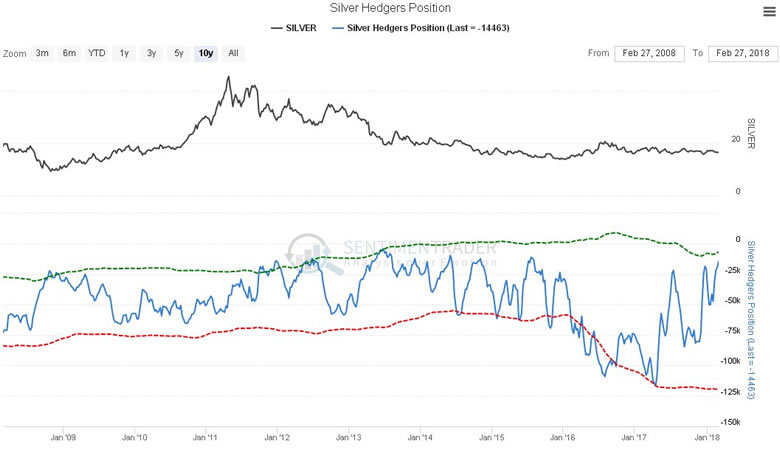
Chart courtesy of sentimentrader.com
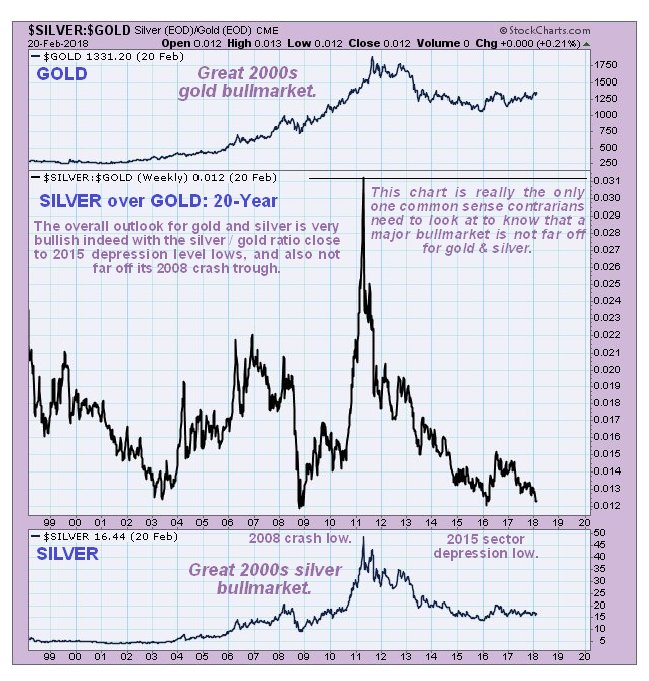
Finally, we take a look at the silver/gold ratio, which shows that on the last three occasions that the ratio got this low over the past 20 years, it marked a bottom and presaged a major uptrend in both gold and silver. The first time, in 2003, led to the major bull market of the 2000s, the second time, in 2008, marked the panic low of the 2008 global market crash, and led to major uptrends into parabolic blowoff tops in gold and silver in 2011, the 3rd time, late in 2015, marked the final bear market lows in gold and silver, which were followed by the rise out of the low of the Head of their respective Head-and-Shoulders bottoms.
The full potential implied by this last very low reading of the silver/gold ratio late in 2015 is a long way off being realized, and the great news for would be investors in the sector is that the dip by the ratio in the recent past to approach its late 2015 lows has been accompanied by a corresponding drop in the price of silver and silver investments, making them extremely cheap again, but this is believed to be the last time we will see these low prices on offer, especially as the dollar has broken down from a major top area and is now entering what could easily turn out to be a severe downtrend.
Clearly, from all of the above, we are at a great juncture to buy the silver sector aggressively now—silver ETFs, silver ETFs and silver stocks. We have looked at a selection of silver stocks in the recent past and will be adding to them, and in addition we went for a couple of leveraged silver bull ETFs about a week ago, which are now at about the same prices and still look very attractive.
Clive Maund has been president of www.clivemaund.com, a successful resource sector website, since its inception in 2003. He has 30 years' experience in technical analysis and has worked for banks, commodity brokers and stockbrokers in the City of London. He holds a Diploma in Technical Analysis from the UK Society of Technical Analysts.
Disclosure:
1) Statements and opinions expressed are the opinions of Clive Maund and not of Streetwise Reports or its officers. Clive Maund is wholly responsible for the validity of the statements. Streetwise Reports was not involved in the content preparation. Clive Maund was not paid by Streetwise Reports LLC for this article. Streetwise Reports was not paid by the author to publish or syndicate this article.
2) This article does not constitute investment advice. Each reader is encouraged to consult with his or her individual financial professional and any action a reader takes as a result of information presented here is his or her own responsibility. By opening this page, each reader accepts and agrees to Streetwise Reports' terms of use and full legal disclaimer. This article is not a solicitation for investment. Streetwise Reports does not render general or specific investment advice and the information on Streetwise Reports should not be considered a recommendation to buy or sell any security. Streetwise Reports does not endorse or recommend the business, products, services or securities of any company mentioned on Streetwise Reports.
Charts provided by the author.
CliveMaund.com Disclosure:
The above represents the opinion and analysis of Mr Maund, based on data available to him, at the time of writing. Mr. Maund's opinions are his own, and are not a recommendation or an offer to buy or sell securities. Mr. Maund is an independent analyst who receives no compensation of any kind from any groups, individuals or corporations mentioned in his reports. As trading and investing in any financial markets may involve serious risk of loss, Mr. Maund recommends that you consult with a qualified investment advisor, one licensed by appropriate regulatory agencies in your legal jurisdiction and do your own due diligence and research when making any kind of a transaction with financial ramifications. Although a qualified and experienced stockmarket analyst, Clive Maund is not a Registered Securities Advisor. Therefore Mr. Maund's opinions on the market and stocks can only be construed as a solicitation to buy and sell securities when they are subject to the prior approval and endorsement of a Registered Securities Advisor operating in accordance with the appropriate regulations in your area of jurisdiction.
© 2005-2022 http://www.MarketOracle.co.uk - The Market Oracle is a FREE Daily Financial Markets Analysis & Forecasting online publication.


