Gold and Silver Advance Setup Shows New Highs Are Imminent
Commodities / Gold and Silver Stocks 2018 Mar 07, 2018 - 05:46 PM GMTBy: Chris_Vermeulen
 We’ve been warning about the future moves in the metals markets for a week to our members and readers. Our most recent work showed the metals needed to decline a bit before any new advancement leg could properly setup. Just recently, we profited from the Gold and Silver pulled back taking advantage of our downward predicting, which should setup a strong leg higher which is starting to unfold now. Yes, this could be the beginning of a new bullish leg that metals bugs have been waiting for.
Before we get into the details, we want to alert you that his new advancement leg should be the beginning of a new Wave 3 price advance. This type of price advancement should last many months and consist of multiple price rotations. All we are highlighting today is the eminent price advance that should take place before the end of March. Our more timely and detailed research, which is typically only shared with our subscribers.
In fact, on Friday we sent all the subscribers who joined our 1 or 2-year Wealth Building Newsletter plans our newest book “The Crash of 2018-2020 – How You Can Profit” which is exclusive to those member’s and we look two years into the future and what we should be aware of.
Gold Daily Charts
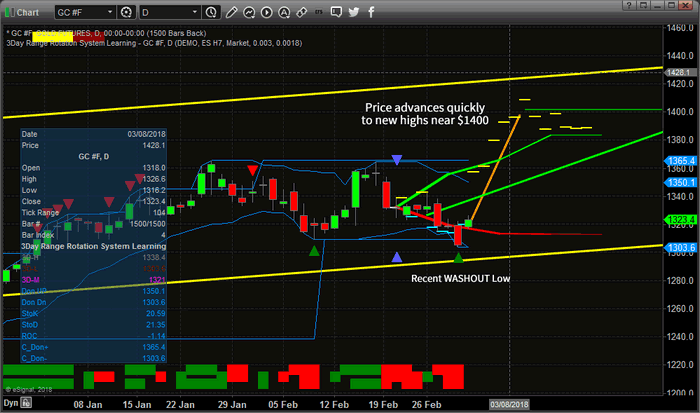
First chart of gold: Take a look at our adaptive price modeling system on this Daily Gold chart. This analysis is showing the price advance in the Gold should start with a strong move on March 5th and continue for at least a week – breaking recent highs and advancing towards $1400 before March 12th. After this move completes, a short period of congestion near $1400 should be expected before any further advance. Get ready if you want to take advantage of this $80 advance in Gold. We’re calling this move on March 3rd – so you have lots of time to get setup for the run.

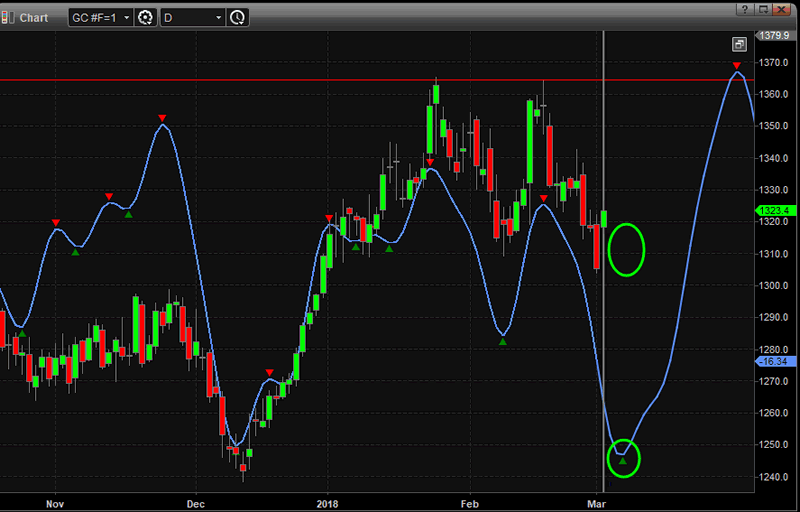
Second chart of gold: This chart shows a different type of analysis, which is based on the most recent and most recurring time cycles at play in gold.

Silver Daily Charts
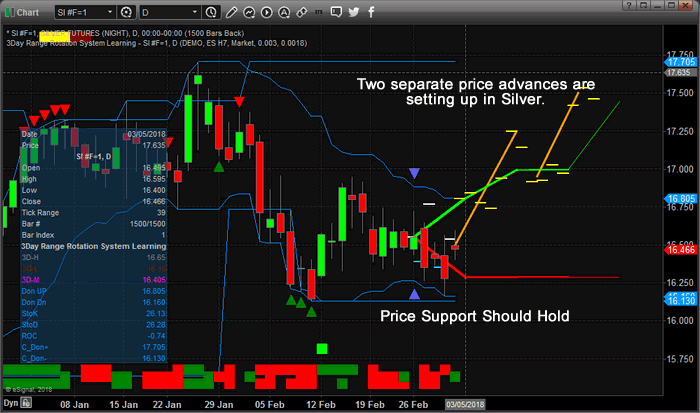
The setup in Silver is even more interesting because our adaptive price modeling system is showing two unique advanced in prices over the next few weeks. This means, as traders, we will have two unique opportunities to trade these advances.
The first move appears to start very early on March 5th with a moderate price advance early in the week, followed by 2 or 3 days of stalled prices. Prices then continue an aggressive move higher near the 9th or 10th of March. Shortly after that peak, prices will retrace to just below $17.00 for a few days – setting up a fantastic buying opportunity for the second advancement to near $17.50.
For traders, this is a fantastic setup. The first leg higher represents $0.60~0.70 rally in silver. The second leg represents a $0.40~0.50 rally. Combined for a $1.00~1.20 total in two quick trades. And, YES, we know about these moves because of our adaptive predictive price modeling system – which is capable of showing us the highest probability price outcomes many days or weeks into the future.

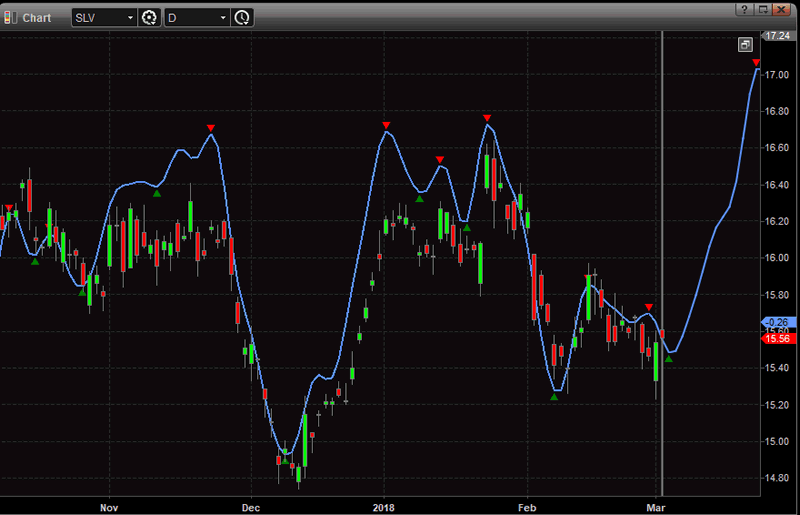
Second chart of silver: This chart shows a different type of analysis, which is based on the most recent and most recurring time cycles at play in silver.

We share this analysis so that you have some real predictive data to work with through March. We are not always 100% accurate in our modeling systems predictions or accuracy, but you can spend a little time reading our research reports through most of this year to see how we’ve been calling these market moves since well before the start of 2018. Visit www.TheTechnicalTraders.com to see what we offer our subscribers and learn how we can assist you in finding great trading opportunities. In fact, pay attention to the market moves as they play out over the next few weeks to see how accurate our research really is. We’re confident you will quickly understand that we provide the best predictive analysis you can find and are proud to offer our clients this type of research.
Get ready for this move and don’t miss the future ones. We’ll keep our members aware of all of these moves going forward so they can take advantage of these opportunities to generate profits. Hope to see you in our member’s area, as well, where we can share more data and research to help you profit from these moves – visit www.TheTechnicalTraders.com to learn more.
Chris Vermeulen
www.TheTechnicalTraders.com
Chris Vermeulen has been involved in the markets since 1997 and is the founder of Technical Traders Ltd. He is an internationally recognized technical analyst, trader, and is the author of the book: 7 Steps to Win With Logic
Through years of research, trading and helping individual traders around the world. He learned that many traders have great trading ideas, but they lack one thing, they struggle to execute trades in a systematic way for consistent results. Chris helps educate traders with a three-hour video course that can change your trading results for the better.
His mission is to help his clients boost their trading performance while reducing market exposure and portfolio volatility.
He is a regular speaker on HoweStreet.com, and the FinancialSurvivorNetwork radio shows. Chris was also featured on the cover of AmalgaTrader Magazine, and contributes articles to several leading financial hubs like MarketOracle.co.uk
Disclaimer: Nothing in this report should be construed as a solicitation to buy or sell any securities mentioned. Technical Traders Ltd., its owners and the author of this report are not registered broker-dealers or financial advisors. Before investing in any securities, you should consult with your financial advisor and a registered broker-dealer. Never make an investment based solely on what you read in an online or printed report, including this report, especially if the investment involves a small, thinly-traded company that isn’t well known. Technical Traders Ltd. and the author of this report has been paid by Cardiff Energy Corp. In addition, the author owns shares of Cardiff Energy Corp. and would also benefit from volume and price appreciation of its stock. The information provided here within should not be construed as a financial analysis but rather as an advertisement. The author’s views and opinions regarding the companies featured in reports are his own views and are based on information that he has researched independently and has received, which the author assumes to be reliable. Technical Traders Ltd. and the author of this report do not guarantee the accuracy, completeness, or usefulness of any content of this report, nor its fitness for any particular purpose. Lastly, the author does not guarantee that any of the companies mentioned in the reports will perform as expected, and any comparisons made to other companies may not be valid or come into effect.
Chris Vermeulen Archive |
© 2005-2022 http://www.MarketOracle.co.uk - The Market Oracle is a FREE Daily Financial Markets Analysis & Forecasting online publication.


