NDX makes a new high. What does that mean?
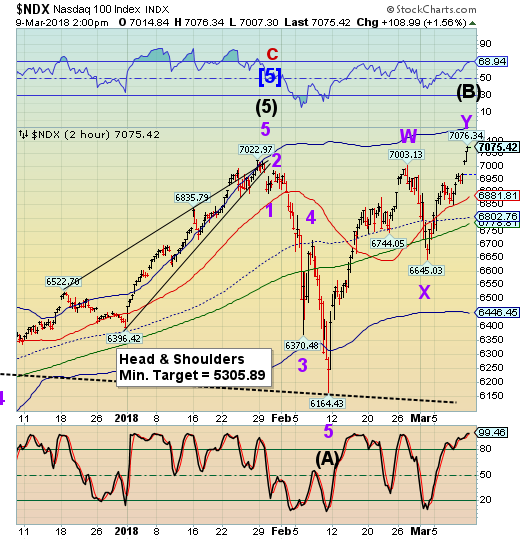
Stock-Markets / Tech Stocks Mar 10, 2018 - 04:00 PM GMT The big question being asked is what’s happening with the NDX. I spent a considerable time re-analyzing the NDX at all degrees to see what insight I might get. All of the Waves up to January 26 were impulsive. So, how could a complex double zigzag fit in? The answer lies in the fact that a Wave (B) may exceed the length of its corresponding Wave (A). So, while the SPX and DJIA are still making lower highs, the NDX may simply be giving a non-confirmation top.
There is a precedent for this. In January 2000 the DJIA made its top at 11750.20 while the NDX did not make its high of 4816.24 until March 24. However, 17 market days later the NDX was at a low of 3107.42 (35.5% lower). The point of this is that we may be expecting a severe low in approximately the same time period.

Should the market break today, we may see an even larger decline with a potential low between March 21 and March 28.
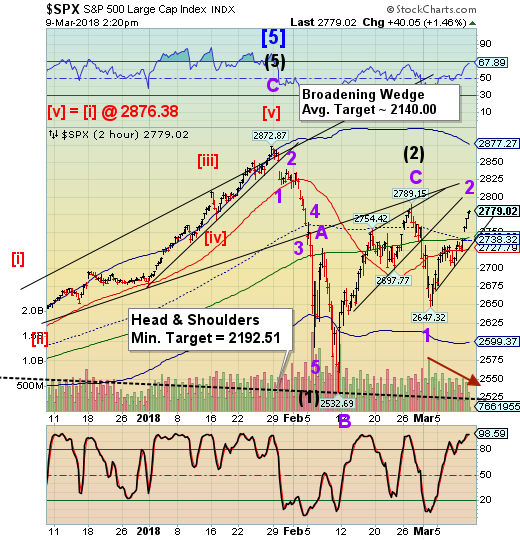
SPX appears to have made a double zigzag Wave 2. Although it is not my favorite formation, it fits the current scenario that Wave (3) may have already begun in the SPX.

ZeroHedge reports, “Add one more paradox to a market that seemingly refuses to follow any logic.
In a week in which the S&P did not suffer one down day despite the "Cohn Gone" scare and Trump's trade war announcement, US stocks suffered "massive" - in Reuters' words - outflows, according to BofA analysts and EPFR data, which found that investors rushed into government bonds and other safer assets.
Yet while investors bailed on stocks, someone else was clearly buying, as seen by the S&P's weekly performance. How is this possible? Two words - stock buybacks.”
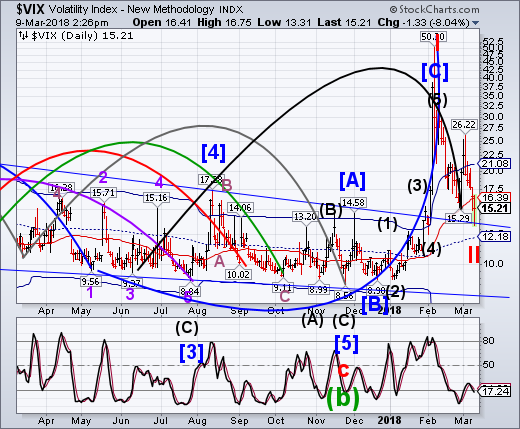
VIX tested the Ending Diagonal trendline this morning and has been above it, since. It may be a very appropriate bottom for a Cycle Wave II.

ZeroHedge remarks, “10Y Treasury yields are back above 2.90% - the highest since spiking on Powell hawkish comments - and back into what some have called the 'danger zone' for stocks...
Last month's payrolls print (blue rectangle) prompted a spike in yields which sparked a drop in stocks and the collapse of XIV and the short-vol trade...”
TNX rose as high as 29.14 this morning, putting it in the “danger zone” for stocks. The shape of the bounce was an a-b-c pattern, which makes it uncertain which direction it will go, sonce it could be either a Wave [b] or the beginning of an Ending Diagonal rally higher. As mentioned earlier, we must see a break in either direction to know what we are dealing with.

Regards,
Tony
Our Investment Advisor Registration is on the Web.
We are in the process of updating our website at www.thepracticalinvestor.com to have more information on our services. Log on and click on Advisor Registration to get more details.
If you are a client or wish to become one, please make an appointment to discuss our investment strategies by calling Connie or Tony at (517) 699-1554, ext 10 or 11. Or e-mail us at tpi@thepracticalinve4stor.com .
Anthony M. Cherniawski, President and CIO http://www.thepracticalinvestor.com
As a State Registered Investment Advisor, The Practical Investor (TPI) manages private client investment portfolios using a proprietary investment strategy created by Chief Investment Officer Tony Cherniawski. Throughout 2000-01, when many investors felt the pain of double digit market losses, TPI successfully navigated the choppy investment waters, creating a profit for our private investment clients. With a focus on preserving assets and capitalizing on opportunities, TPI clients benefited greatly from the TPI strategies, allowing them to stay on track with their life goals.
Disclaimer: The content in this article is written for educational and informational purposes only. There is no offer or recommendation to buy or sell any security and no information contained here should be interpreted or construed as investment advice. Do you own due diligence as the information in this article is the opinion of Anthony M. Cherniawski and subject to change without notice.
Anthony M. Cherniawski Archive |
© 2005-2022 http://www.MarketOracle.co.uk - The Market Oracle is a FREE Daily Financial Markets Analysis & Forecasting online publication.


