Just Another Minor Stock Market Pullback Within a Secular Advance
Stock-Markets / Stock Markets 2018 Mar 12, 2018 - 04:45 AM GMTBy: Donald_W_Dony
 The retracement over the last few weeks has sparked many investors and market pundits to suspect that the bull market may be nearing a crest.
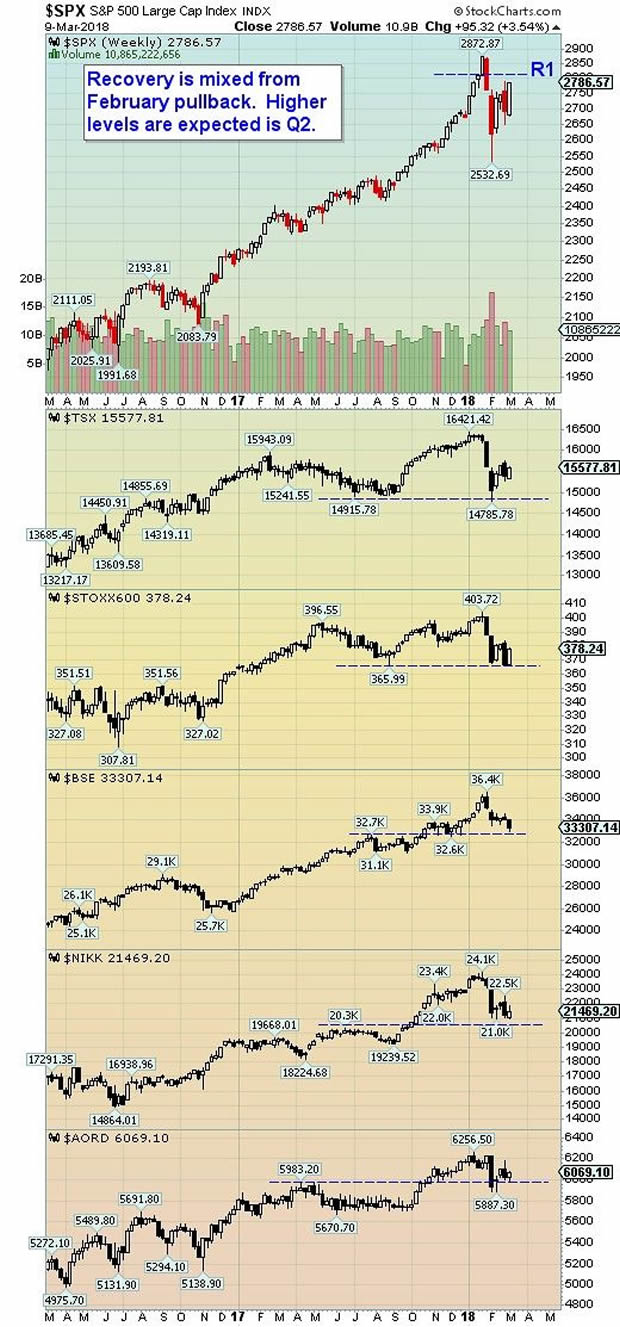
Most world indexes pulled back around 10 percent before finding support in late February and early March. And this was just after reaching new all-time highs in January.
Certainly not the kind of pattern that is associated with major tops in the markets.
For example, the last two major market peaks (2000 and 2008) have had several things in common.

First, the rollover was measured. That is the event took place over several months. As this recent price action is still fresh, we do not have enough evidence to say definitely if this movement in February and March is the beginning of a deeper decline. However, the outlook of a full recovery holds the highest probability.
Second, market corrections typically occur in coordination with several key economic markers.
One of them is a flat or inverted U.S. Yield Curve. This is when short-term rates (1 month to 3 month) are equal or higher then long-term rates (20 and 30 year). This is not the case now. Short-term rates are below long-term indicating a normal Yield Curve. This pattern also suggests that there is more room for economic growth.
The other marker is the U.S. Unemployment rate.
The rates now sits at 4.1 percent - a 17-year low.
Market corrections are associated with an increase in unemployment. The characteristic of the U.S. Unemployment rate prior to any market top is for a period, usually 6 to 12 months, of 'bottoming out' and then starting to increase. Though this economic gauge lags the stock market by several months, there are no signs currently of even a floor developing.
Bottom line: Our technical and economic measures indicate that the recent pullback in the markets was only just another short-term spill off and not the beginning of a deep decline.
Our target of 3000 for the S&P 500 and 28,100 for the Dow still stands.
By Donald W. Dony, FCSI, MFTA
www.technicalspeculator.com
COPYRIGHT © 2018 Donald W. Dony
Donald W. Dony, FCSI, MFTA has been in the investment profession for over 20 years, first as a stock broker in the mid 1980's and then as the principal of D. W. Dony and Associates Inc., a financial consulting firm to present. He is the editor and publisher of the Technical Speculator, a monthly international investment newsletter, which specializes in major world equity markets, currencies, bonds and interest rates as well as the precious metals markets.
Donald is also an instructor for the Canadian Securities Institute (CSI). He is often called upon to design technical analysis training programs and to provide teaching to industry professionals on technical analysis at many of Canada's leading brokerage firms. He is a respected specialist in the area of intermarket and cycle analysis and a frequent speaker at investment conferences.
Mr. Dony is a member of the Canadian Society of Technical Analysts (CSTA) and the International Federation of Technical Analysts (IFTA).
Donald W. Dony Archive |
© 2005-2022 http://www.MarketOracle.co.uk - The Market Oracle is a FREE Daily Financial Markets Analysis & Forecasting online publication.


