


Nasdaq Stocks Soars to New Record High After Strong Job Reports
Companies / Tech Stocks Mar 14, 2018 - 11:30 AM GMT

Nasdaq soars to an all-time high after last Friday’s U.S. employment report which saw a massive 313,000 growth in February. This is the biggest number of jobs since July 2016, handily smashing the expectation of 200,000 jobs gain.
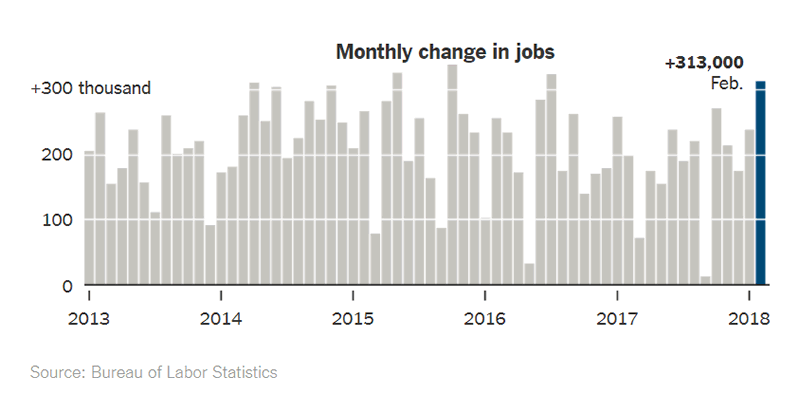
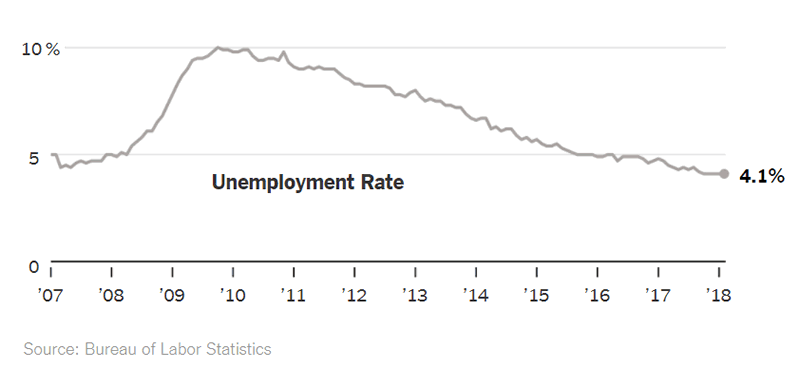
For the fifth month in a row, the jobless rate remains unchanged at 4.1%, a 17-year low.
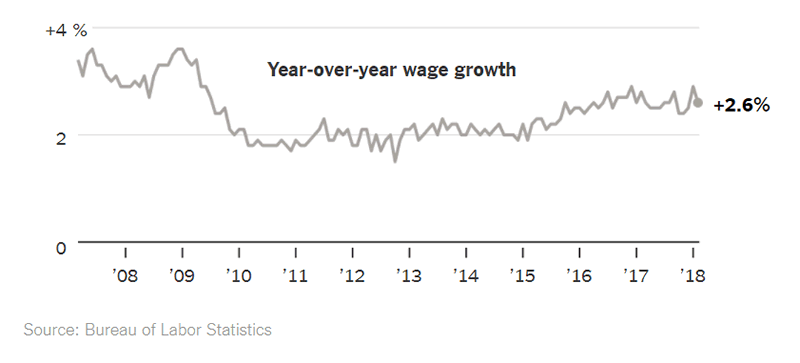
Meanwhile, wages grew less than expected, soothing the inflation fears and pointing to a gradual rise in inflation this year. Average hourly earnings grow 0.1%, a slowdown from the 0.3% rise in January. The year-on-year wage growth slows down to 2.6% from 2.9% in the previous month. Recall that a month ago a jump in wages got investors worried about inflation and set off a stock market decline, giving S&P 500 its first 10% decline in 2 years. An overheating economy raises speculation the Fed might raise rates more aggressively than it has planned. This could damper lending, hiring and business expansion.
The labor market benefits from strong domestic demand, improvement in global growth and strong U.S. business sentiment after President’s Trump $1.5 trillion tax cut package. Wall Street cheered the overall report ans stocks were up strongly. Nasdaq Composite regaining all of its February losses and closed at an all-time high. The Dow Jones Industrial Average and S&P 500 however remain below the old highs of late January.
For the year, Nasdaq is up nearly 8%, S&P 500 is up 3.37% while Dow Jones Industrial Average has risen over 2%. Although the payrolls report on Friday might have eased some inflation concerns, next week’s CPI (Consumer Price Index) and PPI (Producer Price Index) would be very important to watch. These two numbers are due Tuesday and Wednesday, respectively.
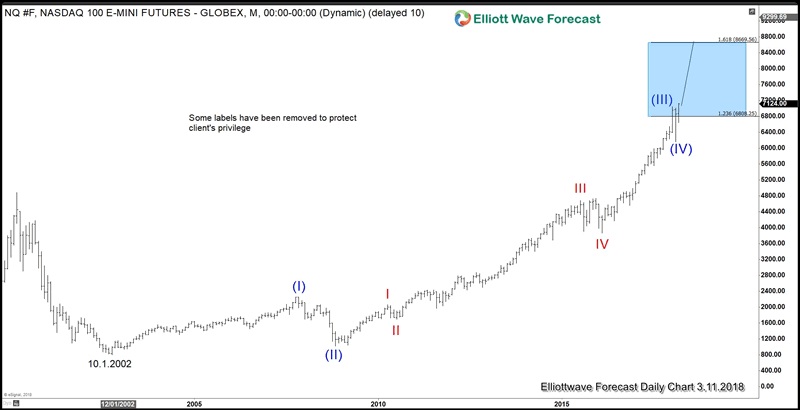
Nasdaq Composite Monthly Elliott Wave Chart
Nasdaq rally from 10.1.2002 low appears to be a clear 5 waves Elliott Wave Impulse structure with an extended wave (III). Wave (I) ended at 2256.25, wave (II) ended at 1017.75, wave (III) ended at 7047.25, and wave (IV) now confirmed to end at 6164 with break to new all-time high. While Nasdaq stays above 6164, the Index could continue higher within wave (V).
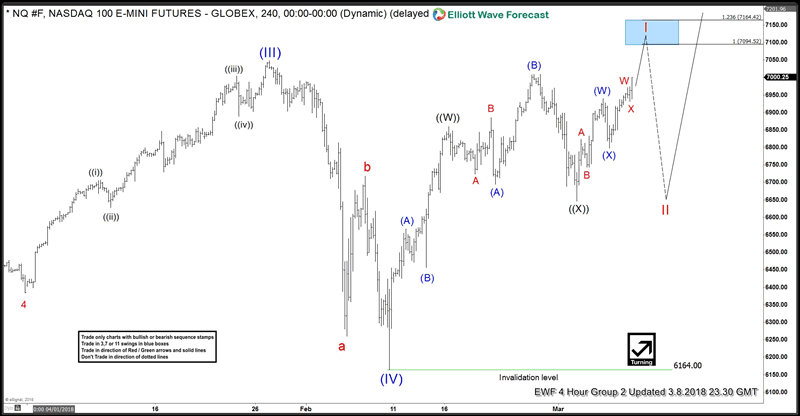
Nasdaq Composite 4 Hour Elliott Wave Chart
Zooming in to the 4 hour chart above, the move higher from wave (IV) at 2.10.2018 low clearly shows only 3 waves so far. As wave (V) needs to subdivide into 5 waves impulse, Nasdaq Composite should have more upside in coming weeks provided that the dips stay above wave (IV) or above 6164.
If you enjoy this article, check our work and just click –> 14 days FREE trial to get access to Elliott Wave charts for 78 instrument, trading signal, 24 hour chat room, and much more.
By Ayoub Ben Rejeb
https://elliottwave-forecast.com
ElliottWave-Forecast has built its reputation on accurate technical analysis and a winning attitude. By successfully incorporating the Elliott Wave Theory with Market Correlation, Cycles, Proprietary Pivot System, we provide precise forecasts with up-to-date analysis for 78 instruments including Forex, Commodities, Indices and a number of Stocks & ETFs from around the World. Our clients also have immediate access to our proprietary Actionable Trade Setups, Market Overview, 1 Hour, 4 Hour, Daily & Weekly Wave Counts. Live Screen Sharing Sessions, Daily Technical Videos, Elliott Wave Setup and Weekend videos .
Copyright © 2018 ElliottWave-Forecast - All Rights Reserved Disclaimer: The above is a matter of opinion provided for general information purposes only and is not intended as investment advice. Information and analysis above are derived from sources and utilising methods believed to be reliable, but we cannot accept responsibility for any losses you may incur as a result of this analysis. Individuals should consult with their personal financial advisors.
© 2005-2022 http://www.MarketOracle.co.uk - The Market Oracle is a FREE Daily Financial Markets Analysis & Forecasting online publication.