Most Popular
1. It’s a New Macro, the Gold Market Knows It, But Dead Men Walking Do Not (yet)- Gary_Tanashian
2.Stock Market Presidential Election Cycle Seasonal Trend Analysis - Nadeem_Walayat
3. Bitcoin S&P Pattern - Nadeem_Walayat
4.Nvidia Blow Off Top - Flying High like the Phoenix too Close to the Sun - Nadeem_Walayat
4.U.S. financial market’s “Weimar phase” impact to your fiat and digital assets - Raymond_Matison
5. How to Profit from the Global Warming ClImate Change Mega Death Trend - Part1 - Nadeem_Walayat
7.Bitcoin Gravy Train Trend Forecast 2024 - - Nadeem_Walayat
8.The Bond Trade and Interest Rates - Nadeem_Walayat
9.It’s Easy to Scream Stocks Bubble! - Stephen_McBride
10.Fed’s Next Intertest Rate Move might not align with popular consensus - Richard_Mills
Last 7 days
All Measures to Combat Global Warming Are Smoke and Mirrors! - 18th Apr 24
Cisco Then vs. Nvidia Now - 18th Apr 24
Is the Biden Administration Trying To Destroy the Dollar? - 18th Apr 24
S&P Stock Market Trend Forecast to Dec 2024 - 16th Apr 24
No Deposit Bonuses: Boost Your Finances - 16th Apr 24
Global Warming ClImate Change Mega Death Trend - 8th Apr 24
Gold Is Rallying Again, But Silver Could Get REALLY Interesting - 8th Apr 24
Media Elite Belittle Inflation Struggles of Ordinary Americans - 8th Apr 24
Profit from the Roaring AI 2020's Tech Stocks Economic Boom - 8th Apr 24
Stock Market Election Year Five Nights at Freddy's - 7th Apr 24
It’s a New Macro, the Gold Market Knows It, But Dead Men Walking Do Not (yet)- 7th Apr 24
AI Revolution and NVDA: Why Tough Going May Be Ahead - 7th Apr 24
Hidden cost of US homeownership just saw its biggest spike in 5 years - 7th Apr 24
What Happens To Gold Price If The Fed Doesn’t Cut Rates? - 7th Apr 24
The Fed is becoming increasingly divided on interest rates - 7th Apr 24
The Evils of Paper Money Have no End - 7th Apr 24
Stock Market Presidential Election Cycle Seasonal Trend Analysis - 3rd Apr 24
Stock Market Presidential Election Cycle Seasonal Trend - 2nd Apr 24
Dow Stock Market Annual Percent Change Analysis 2024 - 2nd Apr 24
Bitcoin S&P Pattern - 31st Mar 24
S&P Stock Market Correlating Seasonal Swings - 31st Mar 24
S&P SEASONAL ANALYSIS - 31st Mar 24
Here's a Dirty Little Secret: Federal Reserve Monetary Policy Is Still Loose - 31st Mar 24
Tandem Chairman Paul Pester on Fintech, AI, and the Future of Banking in the UK - 31st Mar 24
Stock Market Volatility (VIX) - 25th Mar 24
Stock Market Investor Sentiment - 25th Mar 24
The Federal Reserve Didn't Do Anything But It Had Plenty to Say - 25th Mar 24

Market Oracle FREE Newsletter

How to Protect your Wealth by Investing in AI Tech Stocks

Do Stocks Bull Market Tops Need Breadth Divergences?

Stock-Markets / Stock Markets 2018 Mar 19, 2018 - 07:30 AM GMT

By: Troy_Bombardia

Stock-Markets

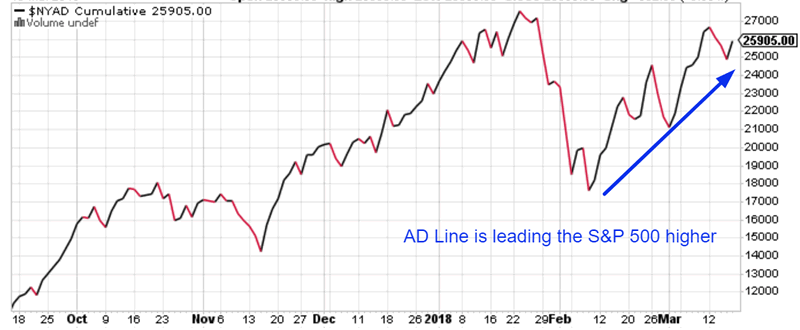
Despite what some bearish investors might say, the U.S. stock market’s breadth is IMPROVING right now. Here’s the NYSE’s Advance-Decline Cumulative Line. It is leading the S&P 500 higher.


Bull market tops are accompanied by bearish breadth divergences. (I.e. more stocks fall than rise in the last leg of a bull market.) These divergences last months if not years. Here are the historical cases:

  1. 2007
  2. 2000
  3. 1973
  4. 1968

Let’s look at these cases in detail.

2007

The U.S. stock market peaked in October 2007. The Advance-Decline line peaked in June 2007 and made a multi-month bearish divergence.

2000

The U.S. stock market peaked in March 2000. The Advance-Decline line peaked in April 1998 and made a bearish divergence that lasted 2 years.
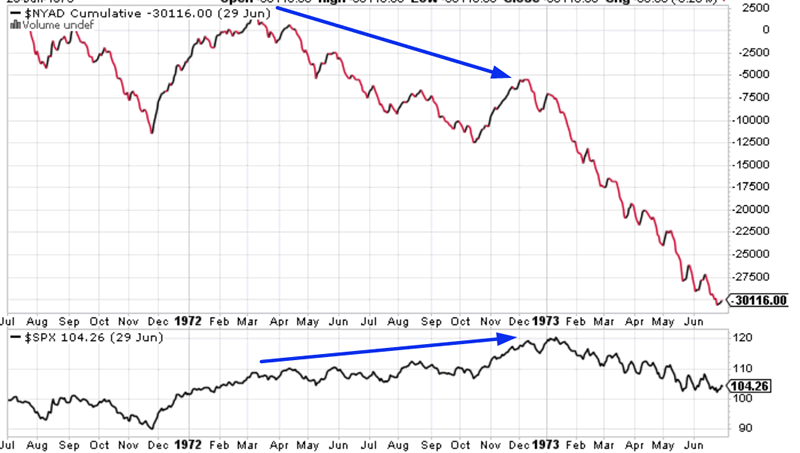
1973

The U.S. stock market peaked in January 1972. The Advance-Decline line peaked in March 1972 and made a bearish divergence that lasted 10 months.
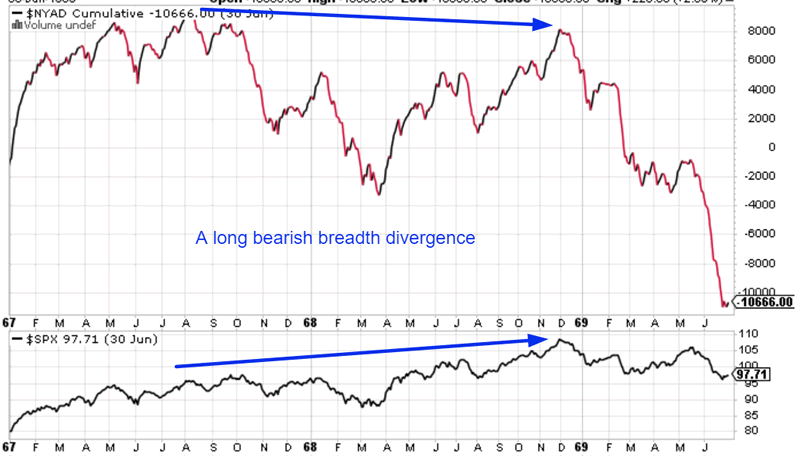
1968

The U.S. stock market peaked in December 1968. The Advance-Decline line peaked in April 1967 and made a bearish divergence that lasted for 1.5 years.

Conclusion

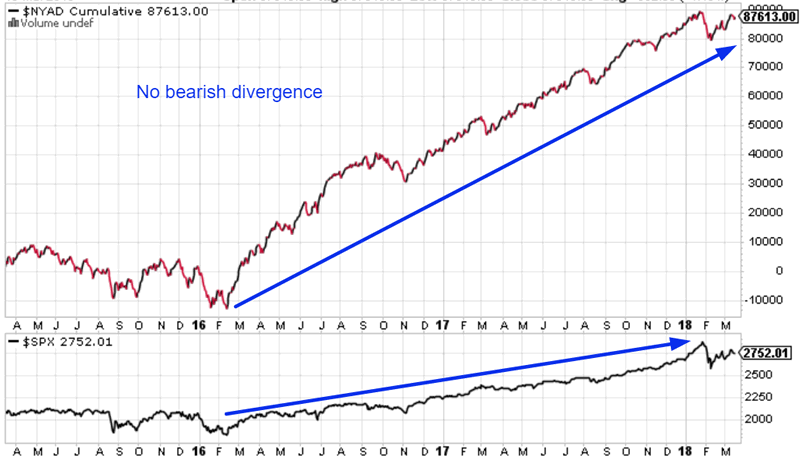
There has been no multi-month bearish breadth divergence today. This implies that the current equities bull market is not over and will last AT LEAST a few more months. This thesis is supported by other studies (Study: strong earnings growth is bullish for stocks).

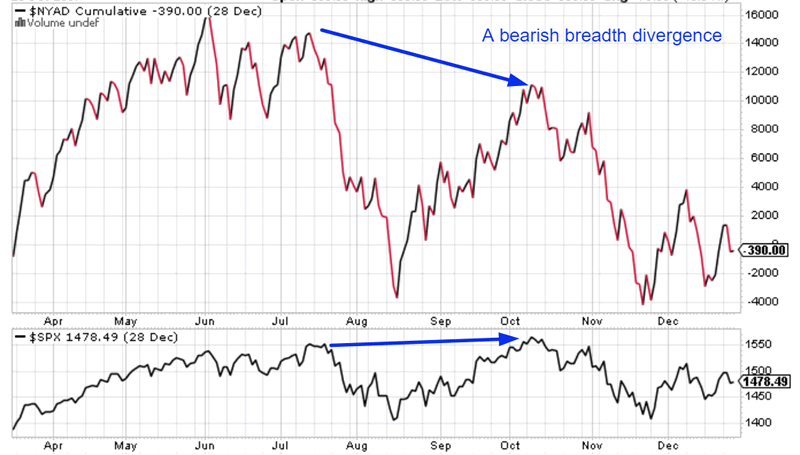
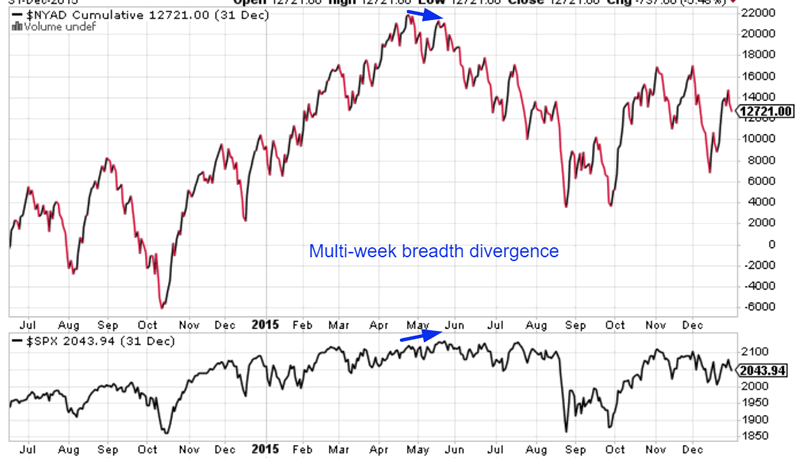
It’s also worth noting that multi-week bearish breadth divergences were common before historical “significant corrections” began. Here’s an example featuring the 2015 “significant correction”.

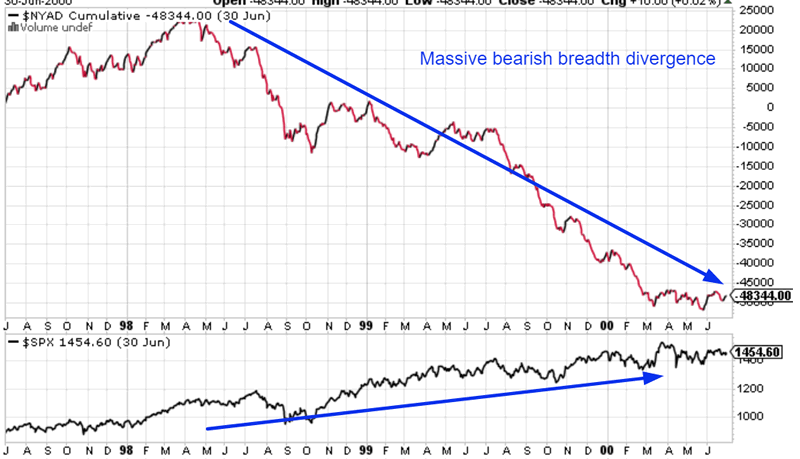
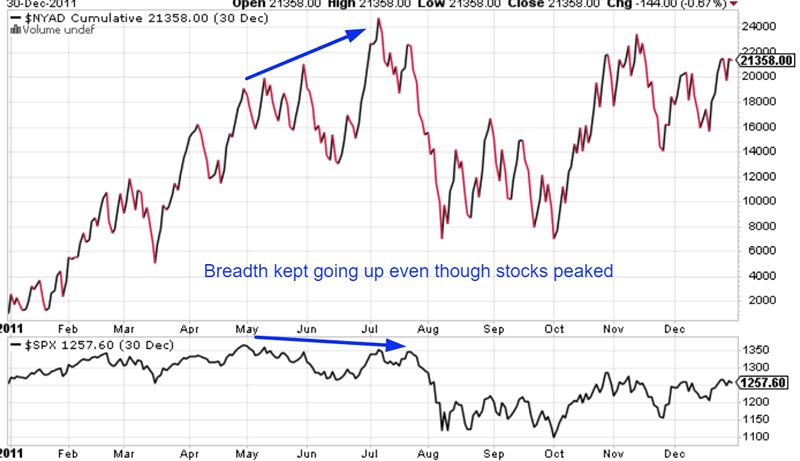
Here’s an example showing that not all “significant corrections” are preceded by bearish breadth divergences. We cannot use breadth divergences to consistently and accurately predict “significant corrections”.

By Troy Bombardia

BullMarkets.co

I’m Troy Bombardia, the author behind BullMarkets.co. I used to run a hedge fund, but closed it due to a major health scare. I am now enjoying life and simply investing/trading my own account. I focus on long term performance and ignore short term performance.

Copyright 2018 © Troy Bombardia - All Rights Reserved

Disclaimer: The above is a matter of opinion provided for general information purposes only and is not intended as investment advice. Information and analysis above are derived from sources and utilising methods believed to be reliable, but we cannot accept responsibility for any losses you may incur as a result of this analysis. Individuals should consult with their personal financial advisors.


© 2005-2022 http://www.MarketOracle.co.uk - The Market Oracle is a FREE Daily Financial Markets Analysis & Forecasting online publication.


Post Comment

Only logged in users are allowed to post comments. Register/ Log in