High Volatility is Bullish for the Stock Market
Stock-Markets / Stock Markets 2018 Mar 30, 2018 - 07:52 AM GMTBy: Troy_Bombardia
 The U.S. stock market’s recent volatility has been very high. We demonstrated in this study that high volatility is a short term bearish sign but a medium term bullish sign for the stock market. Here’s another way of looking at it.
The S&P experienced 4 consecutive days of >1.5% movements (CLOSE vs. CLOSE $) from March 22 – 27, 2018. Some traders think that such high volatility is “bear market behavior”. I disagree.
- This is a very common signal. There is nothing rare about 4 consecutive days of >1.5% movements.
- This is a medium term bullish sign than a bearish sign outside of recessions. There is no recession right now.
Here are the historical cases when the S&P experienced 4 consecutive days of >1.5% movements.
- June 29, 2016
- August 11, 2011
- There were a bunch of cases in 2008. But that’s because the economy was in a recession.
- There were a bunch of cases in 2001-2002. But that’s because the economy was in a recession.
- April 17, 2000
- May 27, 1999
- September 11, 1998
- October 12, 1990
- October 16, 1987
- October 11, 1982
- There were a bunch of cases in 1974. But that’s because the economy was in a recession.
- There was one case in 1970. But that’s because the economy was in a recession.
- August 31, 1966
- May 31, 1962
Here is what the S&P 500 (U.S. stock market) did next.
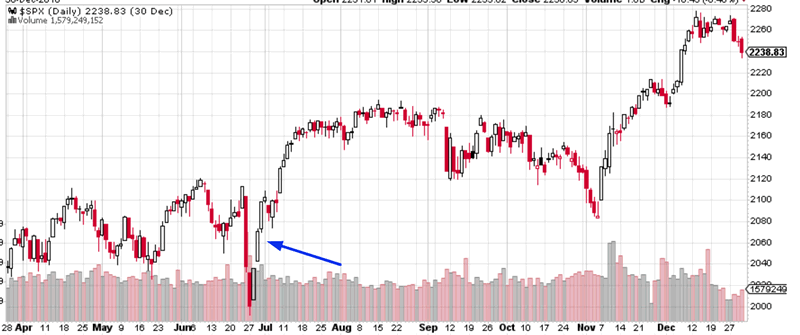
June 29, 2016
This came after the S&P 500’s 6%+ “small correction”. The stock market continued to soar throughout 2016 and 2017. It never retested this level.
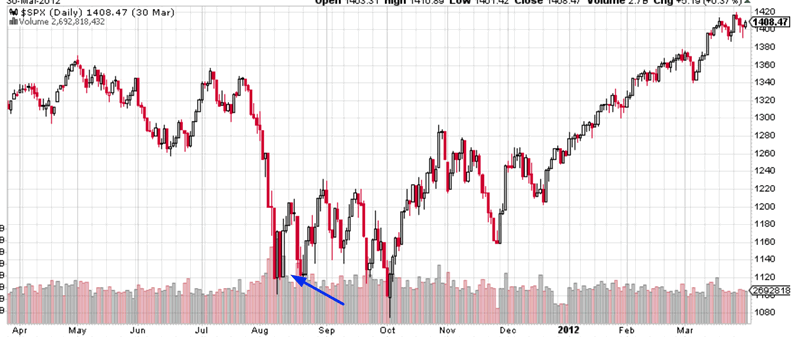
August 11, 2011
This occurred after the first crash in the 2011 “significant correction”. The S&P retested this 2 months later, but downside risk was limited.
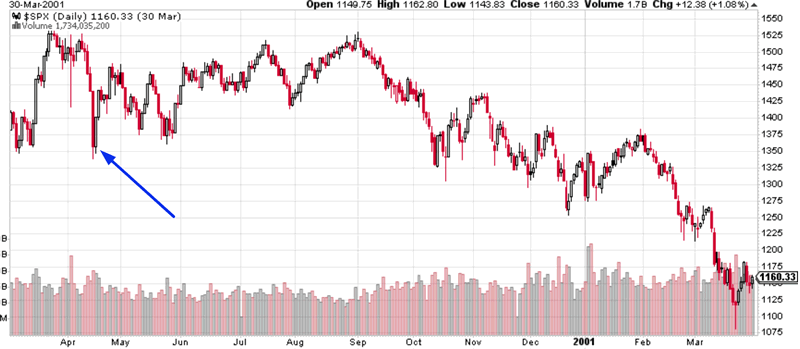
April 17, 2000
This came after the bull market topped on March 24, 2000. The S&P 500 rallied over the next 4.5 months.
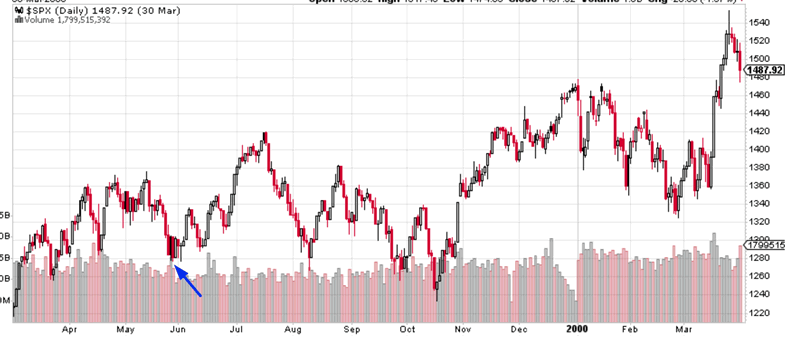
May 27, 1999
The S&P rallied over the next 1.5 months and then retested this level in the next 6%+ “small correction”. HOWEVER, the S&P didn’t really break this low in 1999. The S&P went higher in 1999.
September 11, 1998
The S&P rallied for 2 weeks and then made a marginal new low. However, the downside was limited and the S&P soared throughout the rest of 1998.
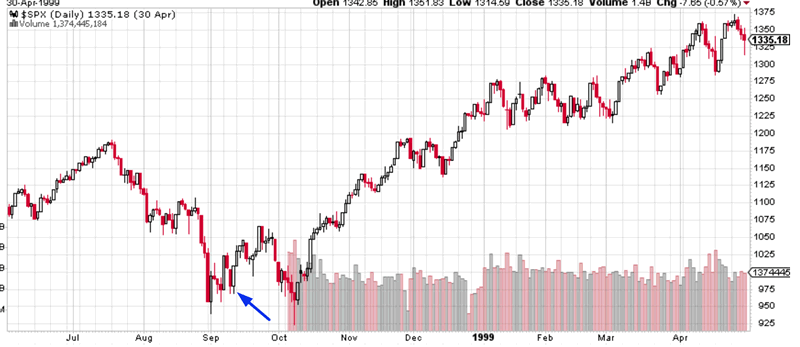
October 12, 1990
This marked the exact bottom of the S&P’s “significant correction”.
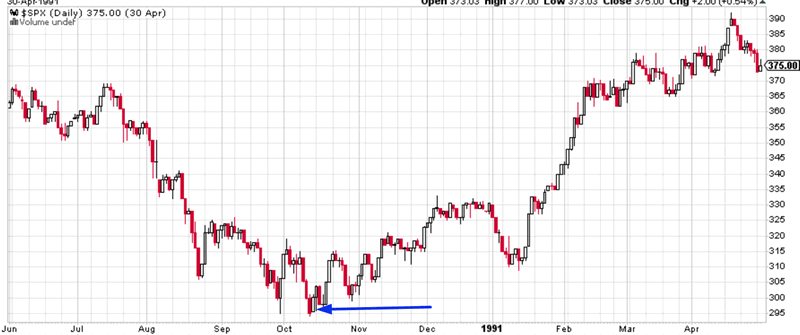
October 16, 1987
The S&P crashed for 2 more days, which put the bottom in the S&P’s “significant correction”.
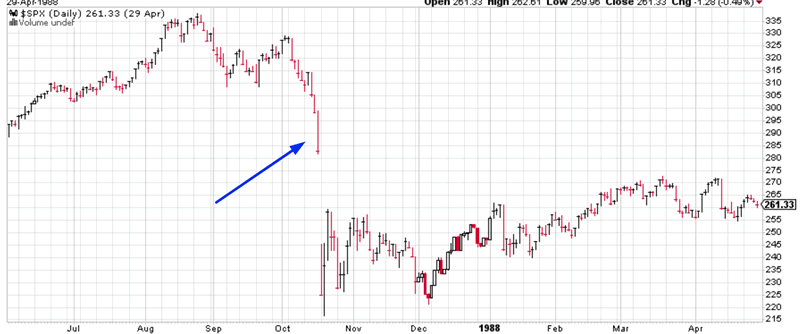
October 11, 1982
The S&P continued to surge over the next 6-12 months. This historical case doesn’t really apply to today. All the volatility was towards the upside (the S&P surged more than 1.5% for 4 consecutive days). The stock market’s current volatility is to the downside.

August 31, 1966
The S&P bounced for 2 weeks and then made a marginal new low. However, the downside was limited and the “significant correction” bottomed soon.
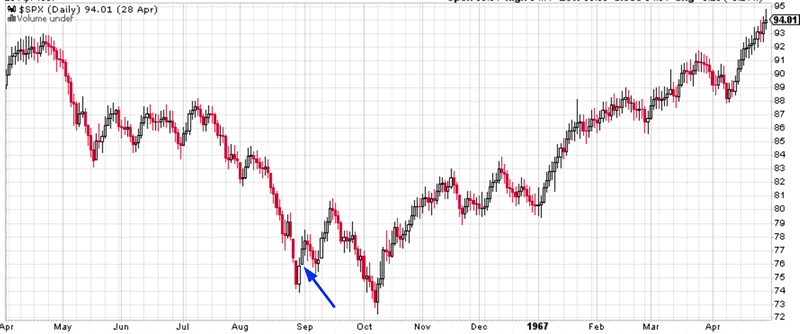
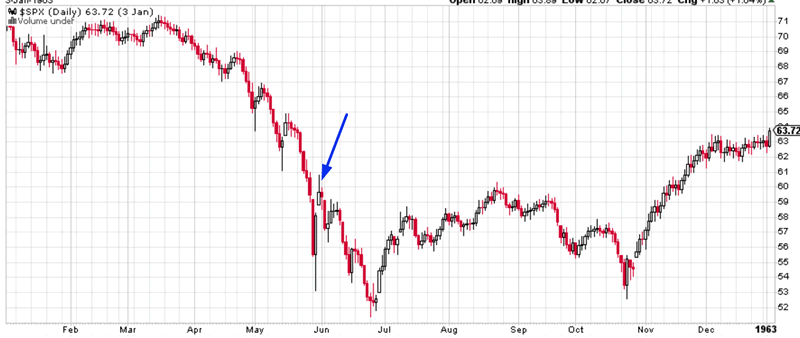
May 31, 1962
The S&P fell for 3 more weeks but the downside was limited. The S&P’s “significant correction” was soon over.
Conclusion
This study sends a loud and clear conclusion:
The stock market might face some short term weakness over 2-3 weeks, but the medium term is decisively bullish. Downside risk is limited.
The notable thing is that even in the beginning of a bear market, the S&P rallied for 4.5 months after this signal came out. The Medium-Long Term Model does not believe that this is a “significant correction” or a bear market.
By Troy Bombardia
I’m Troy Bombardia, the author behind BullMarkets.co. I used to run a hedge fund, but closed it due to a major health scare. I am now enjoying life and simply investing/trading my own account. I focus on long term performance and ignore short term performance.
Copyright 2018 © Troy Bombardia - All Rights Reserved
Disclaimer: The above is a matter of opinion provided for general information purposes only and is not intended as investment advice. Information and analysis above are derived from sources and utilising methods believed to be reliable, but we cannot accept responsibility for any losses you may incur as a result of this analysis. Individuals should consult with their personal financial advisors.
© 2005-2022 http://www.MarketOracle.co.uk - The Market Oracle is a FREE Daily Financial Markets Analysis & Forecasting online publication.


