


Stock Market Volume and Seasonal Trend Analysis
Stock-Markets / US Stock Markets Sep 10, 2008 - 02:56 AM GMTBy: Clif_Droke

 For a good part of the summer, trading volume was exceptionally light on the New York Stock Exchange (NYSE). This was largely influenced by the typical summer vacation season this year. For the better part of July and August, the absence of heavy trading activity coincided with a more or less listless stock market and even a mild interim rally in the S&P 500 and Dow Jones Industrial Average.
Since returning from the summer vacation season, however, institutional traders have taken a good look at the market picture and evidently don't like what they see. This displeasure was manifested in the form of high-volume selling on Thursday, Sept. 4, which saw a upside-to-downside volume ratio on the NYSE of 1:13.
A 1:13 upside/downside volume ratio in favor of selling is normally something we see only at major bottoms, or selling climaxes. Following a prolonged decline or significant correction, a 1:13 volume day can signal that an important market low is imminent. However, when such an extremely high volume ratio is seen at the outset of a selling move it more typically represents what's known as an “initiation climax.” In other words, it suggests another downside move is still to come.
Following last week's 1:13 selling volume day the upside/downside volume ratio for the NYSE on Tuesday, Sept. 9, was 1:11. This was yet another high ratio in favor of selling volume.
That makes two times within the space of four trading days that the upside/downside volume ratio was greater than 1:10. This is a relatively rare event although it has occurred with greater frequency than normal since the credit market trouble started brewing in 2007. Let's take a look at the times in the past couple of years when there have been similar cases of 1:10 selling volume days in close proximity.
The most recent instance of this phenomenon occurred between Feb. 29 and Mar. 6 earlier this year. On Feb. 29 there was a 1:16 upside/downside volume ratio day and an even higher 1:17 selling volume day on March 6 just four trading days later. What was the outcome of this volume pattern? The S&P 500 index declined from 1331 on Feb. 29 when the initial selling volume climax was made to the 1304 level on March 6 when the second volume climax manifested. Two trading days later on March 10, the S&P was at a low for the year of 1273, which proved to be an interim bottom. This was followed by a few days of consolidating around the 1273 level and by the end of the month the S&P had begun a technical rally to 1425 where it peaked out in May.
The next time we saw a similar selling volume pattern was between November 1-7, 2007. On Nov. 1, the upside/downside volume ratio was 1:18 and the S&P closed that day at 1508. Four trading days later on Nov. 7, the volume ratio was 1:15 and the S&P closed at 1520. The very next day the S&P dropped to 1475 and continued declining in a jagged manner for the next 2 ½ weeks before finally bottoming at 1407 on November 26. The S&P then rallied nearly 120 points in a vertical fashion into December before peaking out once again.
Going back even further we see that on July 24, 2007 the selling volume ratio on the NYSE was 1:14. At the time the S&P was trading around the 1510 level. Eight trading days later on Aug. 3, the upside/downside volume ratio was 1:18 as the S&P traded around 1430. This was followed by a 3-day rally to the 1500 level, then a sharp decline to the 1370 on an intraday basis. Looking at the chart of this action in retrospect doesn't seem very impressive but at the time this decline produced an extraordinary reaction on Wall Street and created one of the biggest panic selling-turned intraday reversals in memory.
The outcome suggested by these and other historical studies in NYSE trading volume patterns is that after the dual “selling climax” days are made, the market either declines further or consolidates (with a mild downside bias) for about two more weeks before making an interim bottom. In the present case, if we assume the market will be down for an additional two week period, it would put us very close to the scheduled 6-year cycle bottom at the end of this month.
To get an idea just how many volume climax days there have been on the NYSE since the early part of 2007 when the credit trouble became a mainstream concern, let's examine the following chart.
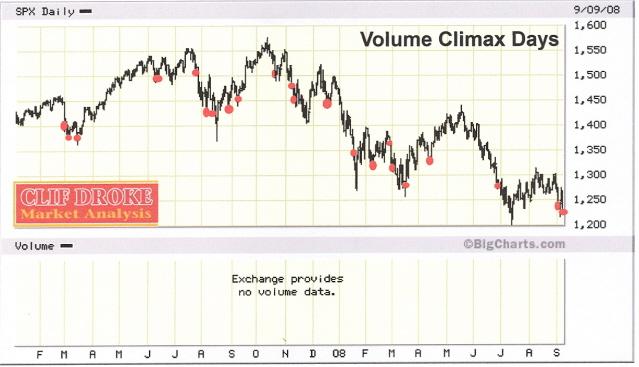
Here we see the S&P 500 Index daily chart going back to 2007. Each time there was a volume climax day on the NYSE it has been highlighted with a red dot. The past 18 months have seen more volume climaxes in the stock market than at any time in history! To what can this extraordinarily high level of share turnover be attributed? We know it can't be attributed to public participation, for the public is no longer a major player in the equities arena. This fact was recently underscored by an article appearing in the Financial Times of Sept. 2. According to the headline, “Volume of individual investors in US equities reaches a record low.” The article went on to state that retail investors held only 34% of shares in the top 1,000 companies at the end of 2006, the last year for which figures are available. By contrast, institutions held 76% of shares in the biggest groups. Since that time the percentage held by institutions and hedge funds has undoubtedly increased while public participation has dropped even further.
The hedge fund “hot money gun slingers” are now responsible for much of the short term volatility in the stock market. The myriad “black box” trading systems utilized by these funds are triggering the same buy and sell signals at the same time and this is what accounts for the huge volume turnovers visible in the above chart. This hedge fund induced volatility is being exacerbated by the dual action of the long-term Kress cycles, namely the 6-year cycle bottom and the 12-year cycle peak.
Once we get the 6-year cycle bottom out of the way at the end of this month, however, volatility should gradually start diminishing and by early 2009 we should see a return to relative normalcy where market volatility is concerned. The hedge fund influence will still be there, of course, but the public should also begin slowly returning to the stock market. This will be a most welcome return as far as I'm concerned since retail investor funds will act as a sort of counterbalance against the trigger happy hedge fund influence. If you ever wondered what the stock market would look like with the public gone from the playing field and the institutional traders in complete control, look at the foregoing chart and you'll have your answer. Since the credit market implosion of 2007, the stock market has become a big money playground where the swing trading hedge funds have monopolized the monkey bars.
Now what about the “unlucky” month of September? According to Stock Trader's Almanac (STA), September tends to be a month when portfolio managers returning from vacation “clean house.” September has been the biggest percentage loser for the Dow, S&P and NASDAQ, according to STA. As STA points out, the month opened strong in nine of the last 12 years but tends to close weak due to end-of-quarter mutual fund portfolio restructuring. STA also cautions that September Triple-Witching Week is dangerous with the week following described as “pitiful.” Actually, it's more often a case of September being a yearly cycle bottom time frame that creates the downward bias in most years, as we'll discuss here.
The following graph is courtesy of Chart of the Day. They observe, “The Dow's average performance for each calendar month since 1950 (blue columns) and 1980 (gray columns). What does the chart show? While the strongest upward bias in stocks has historically occurred during the November-January time frame, September has proven to be the most difficult month for stocks. It is interesting to note how the 1980-present average gain for September has remained negative despite the fact that most of this period included a strong bull market.”
This observation makes sense when viewed from the standpoint of the yearly Kress cycles, which tend to bottom in late September/early October. The latest Kress cycle is the 6-year cycle, which is a key long-term cycle for stocks and the economy. The previous 6-year cycle bottomed along with the 12-year cycle in late September/early October 2002 and it was followed by a vigorous bull market the following year.
By Clif Droke
www.clifdroke.com
Clif Droke is the editor of the daily Gold & Silver Stock Report. Published daily since 2002, the report provides forecasts and analysis of the leading gold, silver, uranium and energy stocks from a short-term technical standpoint. He is also the author of numerous books, including 'How to Read Chart Patterns for Greater Profits.' For more information visit www.clifdroke.com
Clif Droke Archive |
© 2005-2022 http://www.MarketOracle.co.uk - The Market Oracle is a FREE Daily Financial Markets Analysis & Forecasting online publication.