NASDAQ NDX Was Amazon'd
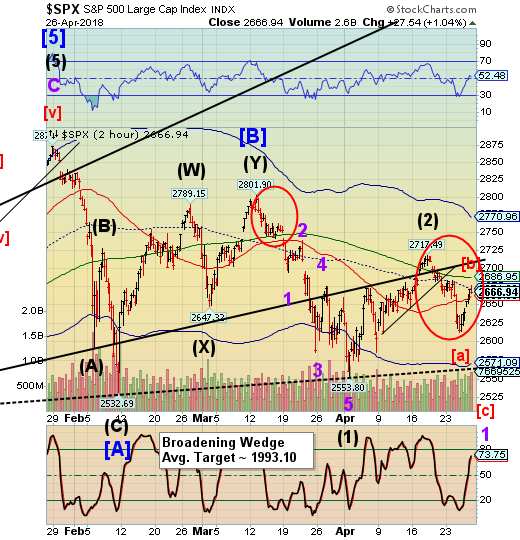
Stock-Markets / Stock Markets 2018 Apr 27, 2018 - 03:29 PM GMT SPX futures are bouncing along just under yesterday’s closing price. The structure of the decline (circled) is fractally similar to the initial decline from the 2801.90 peak. Wave [a] of 1 of (3) is approximately double the size of Wave [a] of 1 of (1). Should it maintain a similar dimension, Wave [c] should break the lower trendline of the Broadening Wedge. Remember, fractals are self-similar and repetitive. The Elliott rule of alternation offers enough variation within each structure to appear different from the last.
Wolf Richter writes, “That would be a first, but it might be happening. Everything in slow motion, even market declines?
There is nothing like a good shot of leverage to fire up the stock market. How much leverage is out there is actually a mystery, given that there are various forms of stock-market leverage that are not tracked, including leverage at the institutional level and “securities backed loans” offered by brokers to their clients (here’s an example of how these SBLs can blow up).
But one type of stock-market leverage is measured: “margin debt” – the amount individual and institutional investors borrow from their brokers against their portfolios. Margin debt had surged by $22.9 billion in January to a new record of $665.7 billion, the last gasp of the phenomenal Trump rally that ended January 26. But in February, as the sell-off was rattling some nerves, margin debt dropped by $20.7 billion to $645.1 billion.”
NDX futures soared 87 points right after the close yesterday on Amazon earnings and appear to be maintaining its elevation above the 50-day Moving Average at 6752.04 and near its prior high at 6856.96. That level happens to be a precise 61.8% Fib retracement of its decline from 7186.09. This may result in a probable flat Wave (2) should the rally stop at or near 6856.96.
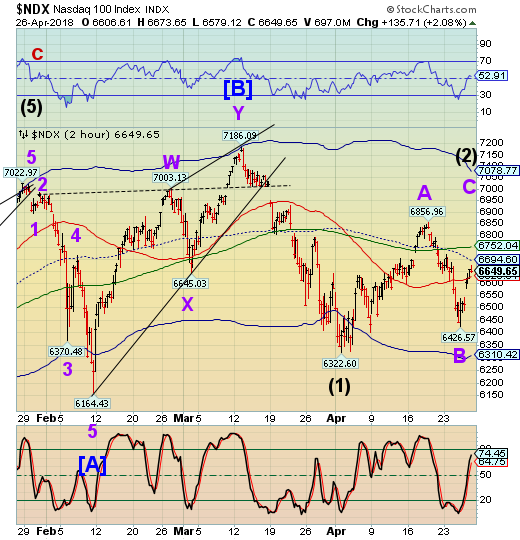
ZeroHedge notes, “In the aftermath of blockbuster earnings from Amazon, which is set to open at an all time high as it breathes down Apple's neck for the title of first $1 trillion market cap company, and Intel, it is hardly a surprise that Nasdaq futures are pointing sharply higher (especially with Gartman shorting the Nasdaq yesterday).
What is more surprising is the broader weakness elsewhere, with Dow futures down 90 points and even the S&P in the red, as Asian shares rose and European equities were little changed. Traders are cautious ahead of today's Q1 GDP print, which is expected to slide from 2.9% to 2.0%, especially in the aftermath of the terrible UK GDP print earlier, which sent cable, gilt yields and May rate hike odds tumbling.”
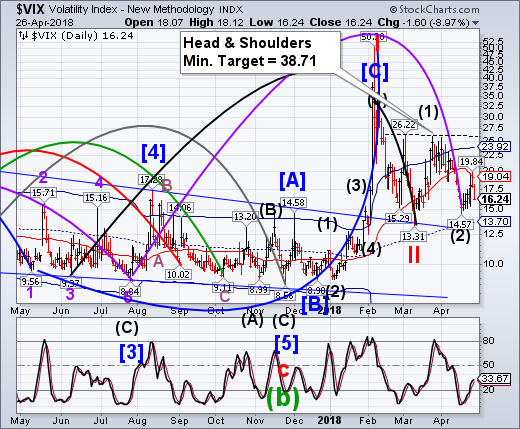
VIX futures are flat this morning with a positive tilt.
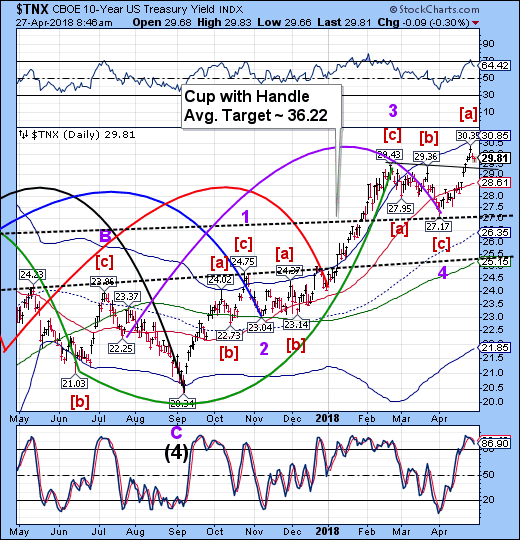
TNX appears to be consolidating after a pullback from its high. The Cycles Model suggests a probable further pullback into mid-week before resuming its rally.
ZeroHedge opines, “Flattening U.S. Yield Curve Story Ain’t Over Yet: Macro View
The rise of U.S. 10-yields above 3% may be the talk of the town this week, but that doesn’t mean yield-curve flattening is finished. U.S. economic data due Friday may bring it right back to center-stage.
Surging commodity prices helped drive the 10-year rate’s ascent, but there are also other supports for higher yields.
The U.S. deficit is forecast to balloon to $1 trillion by 2020, two years earlier than previously forecast, says the Congressional Budget Office. The prices paid component of the Institute of Supply Management advanced in March to its highest level since April 2011, wages are steadily rising, and let’s not forget U.S. inflation reached 2.4% in March, its strongest level in a year.”
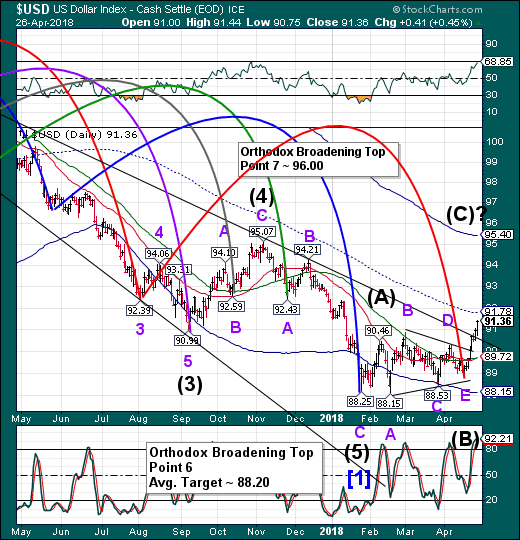
USD futures appear to be challenging the mid-Cycle resistance at 91.78 this morning. We may see a brief pullback to the trendline here prior to resuming its rally. The Cycles Model shows renewed strength through mid-May after the consolidation.
Regards,
Tony
Our Investment Advisor Registration is on the Web.
We are in the process of updating our website at http://mrpracticalinvestor.com/ to have more information on our services. Log on and click on Advisor Registration to get more details.
If you are a client or wish to become one, please make an appointment to discuss our investment strategies by calling Connie or Tony at (517) 699-1554, ext 10 or 11. Or e-mail us at tpi@thepracticalinve4stor.com .
Anthony M. Cherniawski, President and CIOhttp://mrpracticalinvestor.com
As a State Registered Investment Advisor, The Practical Investor (TPI) manages private client investment portfolios using a proprietary investment strategy created by Chief Investment Officer Tony Cherniawski. Throughout 2000-01, when many investors felt the pain of double digit market losses, TPI successfully navigated the choppy investment waters, creating a profit for our private investment clients. With a focus on preserving assets and capitalizing on opportunities, TPI clients benefited greatly from the TPI strategies, allowing them to stay on track with their life goals.
Disclaimer: The content in this article is written for educational and informational purposes only. There is no offer or recommendation to buy or sell any security and no information contained here should be interpreted or construed as investment advice. Do you own due diligence as the information in this article is the opinion of Anthony M. Cherniawski and subject to change without notice.
Anthony M. Cherniawski Archive |
© 2005-2022 http://www.MarketOracle.co.uk - The Market Oracle is a FREE Daily Financial Markets Analysis & Forecasting online publication.


