


Stock Market Range Trading
Stock-Markets / Stock Markets 2018 Apr 30, 2018 - 02:03 PM GMTBy: Andre_Gratian

 Current Position of the Market
SPX: Long-term trend – The bull market is continuing with a top expected in the low 3000s.
Intermediate trend – The intermediate correction from 2873 should continue until about mid-May.
Analysis of the short-term trend is done on a daily basis with the help of hourly charts. It is an important adjunct to the analysis of daily and weekly charts which discusses the course of longer market trends.
Daily market analysis of the short term trend is reserved for subscribers. If you would like to sign up for a FREE 4-week trial period of daily comments, please let me know at ajg@cybertrails.com
Range Trading
Market Overview
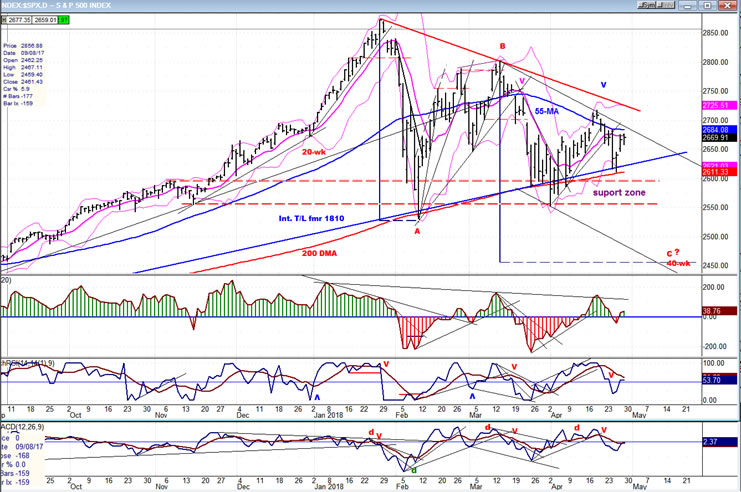
Although volatility prevails over the short-term, the price action remains contained within a quickly narrowing price range which is defined by the descending 55-DMA (2684) and the rising 200-DMA (2611). (Both prices are as of Friday’s close.)
This has created a triangle pattern which will not contain prices much longer, and the next important move will probably start when one of the parameters has been exceeded. At the beginning of the past week, the index dropped to the low of the range with a vengeance, as if it had every intention of continuing its descent toward the 2450 projection -- which (barely) remains in play as long as the 40-week cycle has not made its low. However, by Friday it had rallied back to 2676 and closed at 2670; once again showing that the bulls are still in control of the lower part of the range.
While the odds appear to favor the bulls for an upside break-out, since the 200-DMA should provide more support than the resistance produced by the smaller 55-DMA, and furthermore, the 200-DMA is buffered by an intermediate trend line from the 1810 low, the bears may still have an important advantage in the form of the 40-week cycle which is due to bottom in two or three weeks. I also mentioned last week that a wave 4 will often trade outside of the existing trend line before the move has completed, so we should wait until this tug-o-war is resolved before placing our bets.
The price action is creating a congestion pattern which, when complete, should give us a fairly good idea of the extent of the next move, and which will most likely have to wait until the intermediate cycle has bottomed in two or three weeks. Until then, more range-bound trading is likely, with a good possibility that its low will once again be tested or broken by the middle of next month.
Chart Analysis (These charts and subsequent ones courtesy of QCharts)
SPX daily chart
The price range between the two MAs is narrowing quickly, and it’s a cinch that it is not going to contain prices much longer. There may be another rally beyond the 55-DMA, but it should be limited to the red primary downtrend line (at best) and another move into the support zone (or lower) should be expected as the 40-week cycle makes its low. As you can see, if that cycle bottoms in its ideal time frame, there is still plenty of time for the index to extend its move, up first and then down.
The combined trend line/MA has now been tested three times and if it is again before SPX makes substantial upside headway, I would expect support to be broken before the correction is over, with a minimum decline into the support zone. That zone has been defined by a previous consolidation area in early November 2017. It has halted two previous powerful attempts at dropping prices below it, and may do so again. We should find out before the end of next month.
The 40-wk cycle has earned the respect of analysts, and I am one of them. It has varied in the effect that it has on the market, but this phase may be one of the strongest. One of the reasons I do not expect the correction to end before it has made its low, is because the weekly indicators are still in the process of bottoming and have not yet reversed. The daily indicators are neutral.
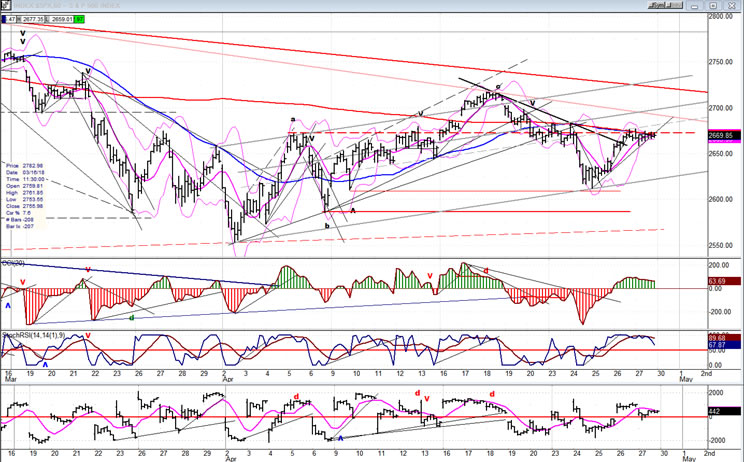
SPX hourly chart
We saw how SPX found support on the 200-DMA on the daily chart. On the hourly chart, we can see that the move from the recent low has been stopped -- at least temporarily -- by the combined 233-hr and 55-hr MAs. Besides the resistance from those two MAs, a minor cycle made its low on Friday and another is due first thing Monday. After both have turned up, their combined pressure should take the index a little higher early next week, but about 2700 may be the extent of its move. After that, there is a good chance that it will be all downhill into mid-May or a little later. I should be able to get a pretty good idea of what the final low should be after this next top has been made.
The hourly indicators may have to develop some negative divergence before the short-term rally which is currently underway, and which should extend into next week, comes to an end. The daily indicators are hovering around neutral territory but, as mentioned earlier, the weekly indicators are not yet ready to give a buy signal -- which is another good reason not to expect this intermediate correction to come to an end until the 40-year cycle has made its low.
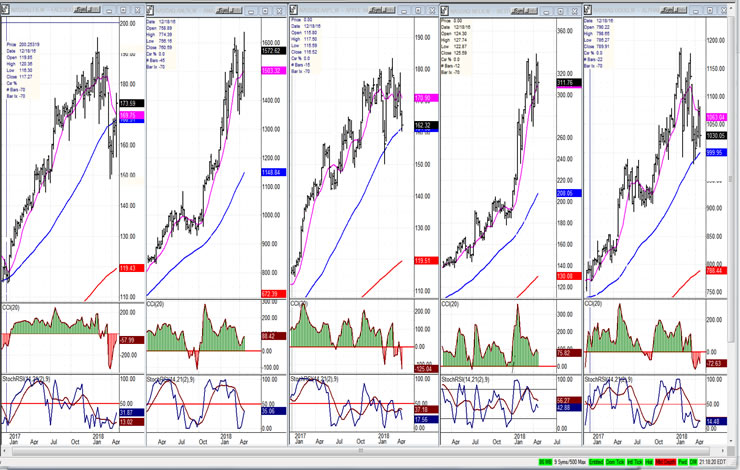
FAANGs (daily charts)
There was some pretty wild action in the FAANGs, last week, especially in Amazon which reported good earnings, causing a horde of buyers to step in and drive the stock to a new all-time high. Facebook, which had been beaten down recently, also reported good earnings and made a strong recovery.
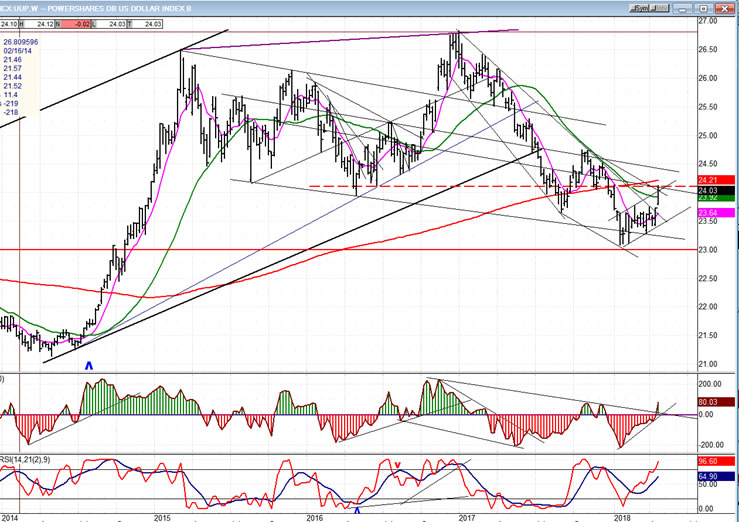
UUP (dollar ETF) Weekly
UUP moved out of a 13-wk base, but only to run into heavy overhead resistance which could put an end to its move; although the indicators are still bullish, suggesting further price advance.
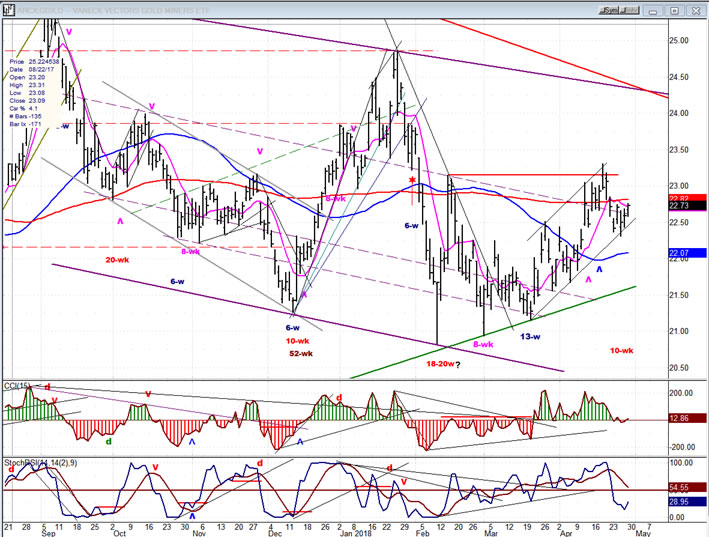
GDX (Gold miners ETF)
GDX is in an uptrend but will not be able to pick up some upside momentum until moves above 23.50. If it does, the P&F chart suggests that it could reach 25.00-25.50 near-term, but it will have to overcome resistance where the two downtrend lines meet -- just above 24.00.
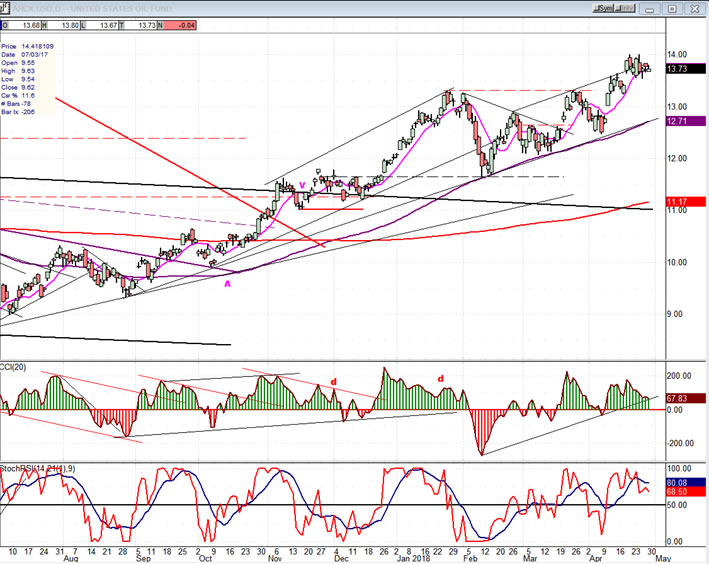
USO (United States Oil Fund)
USO has reached its minimum target zone, but could push to about 15.00 before it starts to correct.
Summary
SPX has been trading in a triangle pattern which it could soon exit with the bottoming 40-wk cycle increasing downward pressure on prices as it nears its low. This should eventually create a retest of the recent low of 2354.
Andre
For a FREE 4-week trial, send an email to anvi1962@cableone.net, or go to www.marketurningpoints.com and click on "subscribe". There, you will also find subscription options, payment plans, weekly newsletters, and general information. By clicking on "Free Newsletter" you can get a preview of the latest newsletter which is normally posted on Sunday afternoon (unless it happens to be a 3-day weekend, in which case it could be posted on Monday).
Disclaimer - The above comments about the financial markets are based purely on what I consider to be sound technical analysis principles uncompromised by fundamental considerations. They represent my own opinion and are not meant to be construed as trading or investment advice, but are offered as an analytical point of view which might be of interest to those who follow stock market cycles and technical analysis.
Andre Gratian Archive |
© 2005-2022 http://www.MarketOracle.co.uk - The Market Oracle is a FREE Daily Financial Markets Analysis & Forecasting online publication.