


Precious Metals and Miners NUGT – The Sleeping Giant Trade
Commodities / Gold and Silver Stocks 2018 May 14, 2018 - 03:42 PM GMTBy: Chris_Vermeulen

 Throughout this year, many analysts have focused on the price of Gold, Platinum & Silver markets for insight to the fear levels that exist in the global markets. Demand for Gold and Silver have been near historically high levels for the past 12+ months and the ratio of Gold to Silver has continued to show that Silver is extremely undervalued in relative value to Gold. We’ve highlighted these facts in previous articles to our readers.
The recent news regarding economic and political concerns regarding a wide range of Emerging Markets and established economies, we believe, has continued to drive upward price pressures in the precious metals markets. We feel the Metals & Miners are setting up a unique opportunity for patient and skilled traders/investors. Possibly, the opportunity of a lifetime if our analysis is correct.
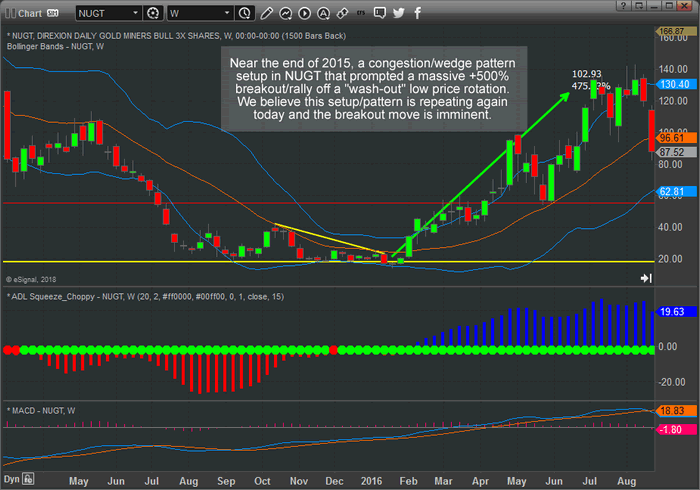
2015 Gold Miners – Weekly NUGT Chart Pattern
Near the end of 2015, NUGT was setting up a congested wedge formation, that lasted 7 months, with clear support near $20. This pennant formation retested support over 6 times before a “wash-out low” price pattern formed as price attempted the eventual breakout. These types of “wash-out” patterns are common as price begins to accelerate into new trends.
Washout lows tend to flush out stops and positions from traders that have their stops too tight for the markets. In this manner, the market is rotating in a matter to reaffirm support before the new bullish trend extends. Notice how quickly price expanded in this uptrend and how price moved above the $30 level in just a week before continuing well above the $120 level. We are illustrating the explosive capabilities of a congestion trade setup like this – well over 500% from the $20 support level.
2018 Gold Miners – Weekly NUGT Chart Pattern
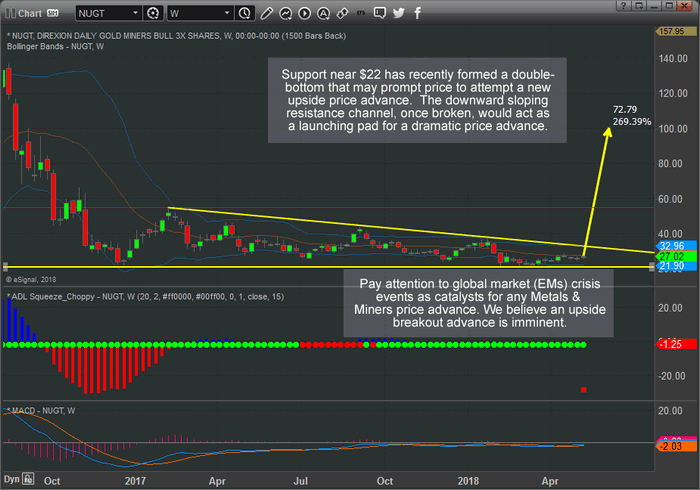
Take a look at a current 2018 NUGT chart (below) and please pay very close attention to the similarities between these two charts. We can’t stress how important it is to understand the opportunity we are showing you today with regards to these patterns and the potential for traders to take advantage of this setup.
The current price pattern setting up in NUGT is another congested wedge formation with support near $22. This pattern has been setting up in the pennant formation for over 12+ months. Price initially rallied from the initial bottom formation (December 2016) and established a price peak @ $54.80 (highlighted in RED).
Afterward, the price has continued to rotate between support and the downward sloping resistance channel presenting traders with a very extended congestion pattern. What interests us the most about this current pattern is the length of the congested wedge pattern. We believe the upside pricing pressure that is being built up within this wedge could be 2x to 3x (or more) the pressure from the 2016 upside breakout. This would indicate that NUGT could rally well past the $100~140 level when this breaks – again a 500%+ price advance.
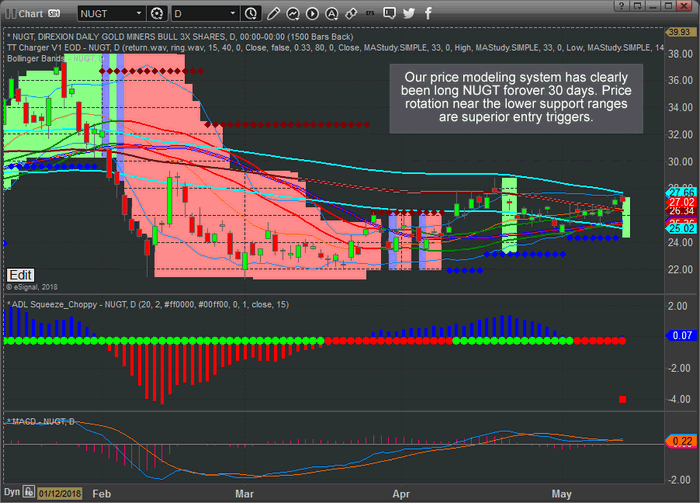
2018 Gold Miners – DAILY Chart Pattern
This Daily NUGT chart shows one of our price modeling systems and shows it has clearly indicated a new bullish trend began on April 10. Lower price support is currently near $24 and ultimate support is near $22. You can see from this modeling system chart that any upside breakout above the CYAN Standard Deviation channel would be very positive within this bullish trend and likely prompt a further upside price rally.
Clearly, any chance at a new trade entry near or below $24.50 is acceptable with risk near $2 per share. Remember, if this breakout/rally happens as we expect, a “wash-out” price rotation may precede this move where stops need to be soft in nature. Support is near $22, but the “wash-out” price rotation may attempt to test price levels below $22 before the massive upside rally begins. So be aware that the smart play is to understand the risk of this trade and play it knowing a “wash-out” price rotation may happen as price breaks these channels.
It is not often that the markets provide traders with these types of setups. These are the type of trades that can make 400~500% or more on a single trade over 4~6 months. We focus on finding opportunities for our members and delivering success for them every month. Members to our Wealth Building Newsletter have already been alerted to this trade setup, and others and will know when a position should be initiated.
Our other recent trade alerts, that are up well over 10% each are UGAZ, FAS, and TECL. These have been rocketing higher – as we predicted. On Friday we closed our TECL position which hit our resistance level and we locked in the 18.3% gains with our members. The single point of success for all of us is to manage our assets well in an attempt to achieve greater long-term success.
If you’ve been following our research and analysis and find it valuable, please visit www.TheTechnicalTraders.com to support our research team and become a valued member. The markets are full of incredible opportunities like this and we focus on delivering critical market research, analysis, Daily video content, detailed trade triggers and continued support for our members. We know you will not find anything like our proprietary price modeling systems and adaptive predictive modeling systems anywhere else.
53 years experience in researching and trading makes analyzing the complex and ever-changing financial markets a natural process. We have a simple and highly effective way to provide our customers with the most convenient, accurate, and timely market forecasts available today. Our stock and ETF trading alerts are readily available through our exclusive membership service via email and SMS text. Our newsletter, Technical Trading Mastery book, and 3 Hour Trading Video Course are designed for both traders and investors. Also, some of our strategies have been fully automated for the ultimate trading experience.
Chris Vermeulen
www.TheTechnicalTraders.com
Chris Vermeulen has been involved in the markets since 1997 and is the founder of Technical Traders Ltd. He is an internationally recognized technical analyst, trader, and is the author of the book: 7 Steps to Win With Logic
Through years of research, trading and helping individual traders around the world. He learned that many traders have great trading ideas, but they lack one thing, they struggle to execute trades in a systematic way for consistent results. Chris helps educate traders with a three-hour video course that can change your trading results for the better.
His mission is to help his clients boost their trading performance while reducing market exposure and portfolio volatility.
He is a regular speaker on HoweStreet.com, and the FinancialSurvivorNetwork radio shows. Chris was also featured on the cover of AmalgaTrader Magazine, and contributes articles to several leading financial hubs like MarketOracle.co.uk
Disclaimer: Nothing in this report should be construed as a solicitation to buy or sell any securities mentioned. Technical Traders Ltd., its owners and the author of this report are not registered broker-dealers or financial advisors. Before investing in any securities, you should consult with your financial advisor and a registered broker-dealer. Never make an investment based solely on what you read in an online or printed report, including this report, especially if the investment involves a small, thinly-traded company that isn’t well known. Technical Traders Ltd. and the author of this report has been paid by Cardiff Energy Corp. In addition, the author owns shares of Cardiff Energy Corp. and would also benefit from volume and price appreciation of its stock. The information provided here within should not be construed as a financial analysis but rather as an advertisement. The author’s views and opinions regarding the companies featured in reports are his own views and are based on information that he has researched independently and has received, which the author assumes to be reliable. Technical Traders Ltd. and the author of this report do not guarantee the accuracy, completeness, or usefulness of any content of this report, nor its fitness for any particular purpose. Lastly, the author does not guarantee that any of the companies mentioned in the reports will perform as expected, and any comparisons made to other companies may not be valid or come into effect.
Chris Vermeulen Archive |
© 2005-2022 http://www.MarketOracle.co.uk - The Market Oracle is a FREE Daily Financial Markets Analysis & Forecasting online publication.