The Coming Copper Crunch
Commodities / Copper May 16, 2018 - 03:07 PM GMTBy: Richard_Mills
 Copper had one of it best years ever in 2017, rising 27% on the back of supply disruptions and steady demand from China, by far the largest copper consumer.
Commodities analysts are usually wrong about copper supply, always predicting a glut in the market for the ubiquitous metal used in everything from piping for plumbing to wiring in houses, to components of electric vehicles. What they fail to account for is the inevitable stoppages at the major copper mines due mostly to strikes and weather problems.
In 2017 however they were right. In January last year a collection of analysts - BMI, Goldman Sachs, Citigroup and TD - were all bullish on copper, saying that after a terrible 2015 and 2016, it would be the strongest performing metal of 2017 with predictions of up to $6,200 a tonne come mid-year. By the end of 2017 copper futures trading on the London Metal Exchange (LME) were at their highest in four years, $7,236.50 a tonne or $3.28 a pound. Copper wasn’t the best performing metal of 2017 (that would be cobalt) but it was third behind palladium.
So how has copper done so far in 2018? The base metal is showing a V-shaped curve, with LME copper starting the year at $7,200 a tonne, bottoming out at $6,499 on March 26, and currently trades at $6,721. Spot copper follows the same pattern. It started 2018 at just under $7,200 and was at $6,782 ($3.08) as of May 4. Copper has traded up sharply since the end of March but has pulled back since the end of April.
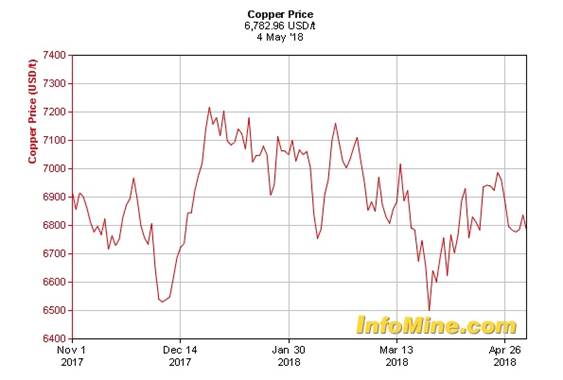
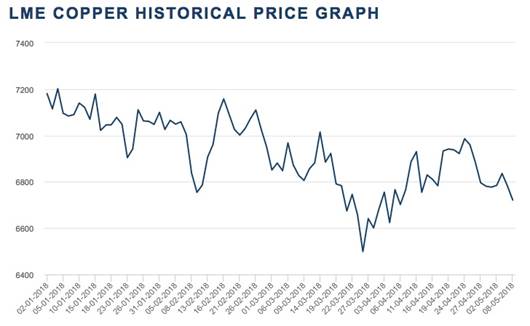
So what’s happening with the copper market and what are the prospects for junior copper companies wanting to find the next big discovery to be gobbled up by a major? This article will take a look at the copper market in detail, including uses, the supply-demand trends, and pricing. The overall conclusion is that copper is heading for a major shortfall, which can only mean one thing: higher prices.
Copper uses
Copper is one of the few metals that occur naturally in the earth’s crust as opposed to needing to be extracted from ore. For that reason, copper was the first metal ever used by early humans, from around 8,000 BC. Three thousand years later homo sapiens figured out how to smelt copper from its ore, and around 3,500 BC, to alloy it with tin to create bronze. Bronze was useful for tools and weapons, making it one of the most important inventions in the history of civilization. Copper was later used in roofing, and still is, for its strength and oxidized green look, as well as in works of art. Copper, or Cu, is also known to be essential for all living organisms. In humans trace elements of copper are found in the liver, muscle and bone. The body contains between 1.4 and 2.1 mg of copper per kilogram.
The Copper Development Association divides modern-day uses of copper into four categories: electrical, construction, transport and other. By far the largest sector for copper usage is electrical, at 65%, followed by construction at 25%.
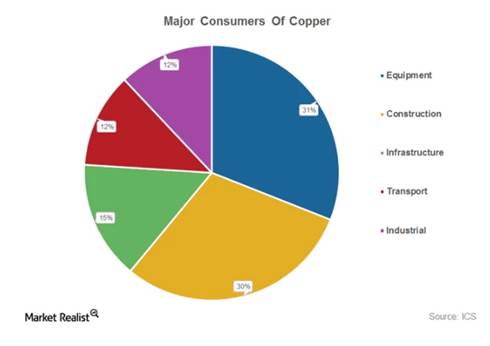
Copper is useful for electrical applications because it is an excellent conductor of electricity. That, combined with its corrosion resistance, ductility, malleability, and ability to work in a range of electrical networks, makes it ideal for wiring. Among electrical devices that use copper, are computers, televisions, circuit boards, semiconductors, microwaves and fire prevention sprinkler systems.
In telecommunications, copper is used in wiring for local area networks (LAN), modems and routers. The construction industry would not exist without copper; as mentioned it is essential for wiring in residential and commercial construction. The red metal is also used for potable water and heating systems due to its ability to resist the growth of water-borne organisms, as well as its resistance to heat corrosion.
Lastly, the transportation industry is reliant on copper for core components of airplanes, trains, cars, trucks and boats. A commercial airliner has up to 190 kilometers of copper wiring, while high-speed trains use up to 10 tonnes of copper per kilometer of track.
Automobiles have used copper and brass radiators and oil coolers since the 1970s. More recent applications including on-board navigation, anti-lock braking systems, heated seats, defrosting wires embedded in windows, hydraulic lines, and wiring for window and mirror controls.
In electric vehicles (EVs), copper is a major component used in the electric motor, batteries, inverters, wiring and in charging stations.
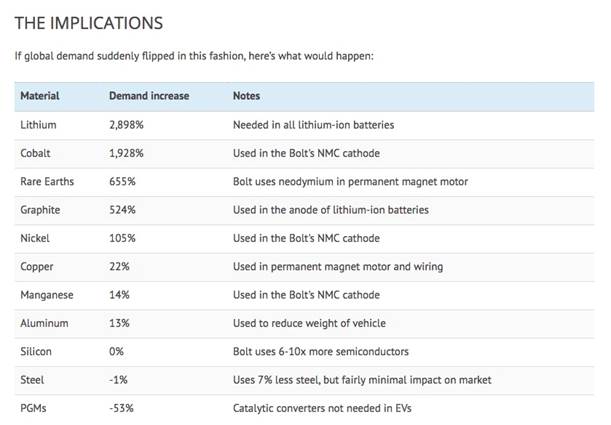
UBS recently did a “thought experiment” whereby they visualized what would happen to the demand for metals that go into EVs if consumers suddenly shifted to Chevy Volts from the current auto mix. They found that copper demand would surge 22% - a fairly modest increase compared to other battery metals which would see leaps of use in the triple digits. (see table below) An average electric vehicle contains 85 kilograms of copper compared to 25 kg for regular vehicles.
The latest use for copper is in renewable energy technologies, particularly in photovoltaic cells used for solar power, and wind turbines.
The copper market
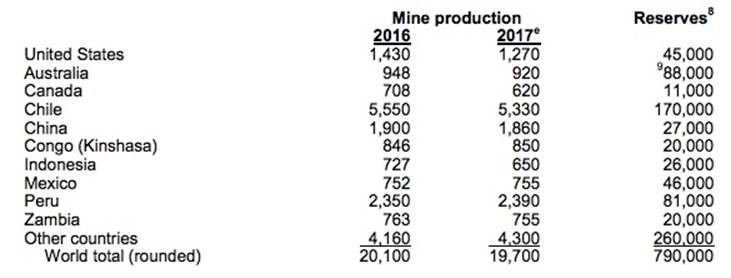
According to the US Geological Survey (USGS) 2.1 billion tonnes of copper resources have been identified throughout the world, with the most common deposit being porphyries, representing 1.8 billion tonnes. By far the country with the most reserves is Chile, at 170 million tonnes, while Australia is second at 88 million tonnes and Peru a close third at 81 million tonnes. JORC-compliant reserves for Australia though are only about 24 million tonnes so really the top two copper depositories are Chile and Peru. The United States has 45 million tonnes of reserves, around the same as Mexico.
In terms of production, in 2017 Chile produced the most copper, 5.3 million tonnes, with Peru second at 2.3 million and the China third, 1.8 million. The US cranked out 1.2 million tonnes of copper last year. Total mined production was just under 20 million tonnes in 2017.
The top four copper companies produce around two-thirds of the metal, and the 10 biggest firms produced $644 billion worth of copper in 2017 at a price of $3.10 a pound, according to stats from Infomine. The top 10 copper companies are, in order, Codelco, Freeport McMoRan, Glencore, BHP Billiton, Southern Copper, KGHM Polska Miedz, Rio Tinto, First Quantum, Antofagasta and Vale.
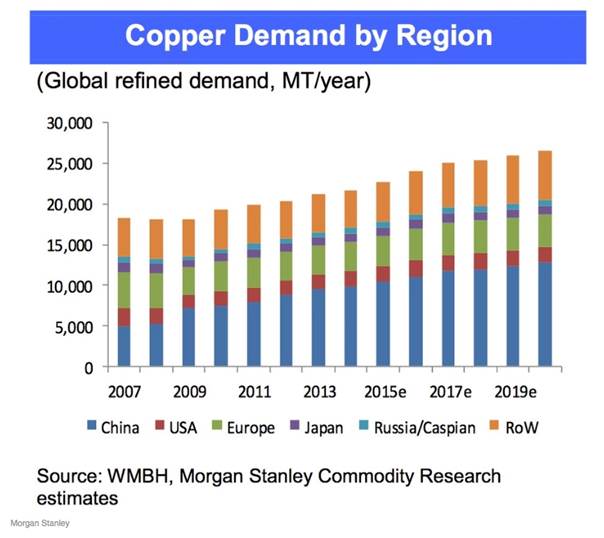
Who buys the most copper? By far the largest copper consumer is China - representing about 50% of global demand. Due to its large manufacturing sector, the Chinese import roughly 70% of the copper they use. Other big copper consumers are the manufacturing sectors in Europe and the United States. Global refined copper demand has risen steadily from 2005, when it was around 18 million tonnes, to the current global consumption of about 24 million tonnes. Immediately we can see that demand is currently outstripping supply by about 4 million tonnes, annually. More on this when we get into the details of the copper forecast.
Before that, let’s take a look at what happened in the copper market in 2017. As mentioned the copper price had one of its best years, rising 27%. Supply issues were one of the main factors driving the price up. According to the International Copper Study Group (ICSG) copper production declined nearly 3% in the first five months of 2017 due primarily to a 43-day strike at Escondida, the world’s largest copper mine in Chile. Lower output from Codelco mines plus a 21-day strike at the Cerro Verde mine in Peru also tightened supply.
Meanwhile in Indonesia, a dispute between US-based producer Freeport McMoran and the Indonesian government saw the country implement a temporary ban on concentrate exports from the Grasberg mine. The ban was lifted three months later. Violent protests erupted at Grasberg last August, after workers were fired for taking part in the strike action. A resolution to the issue was finally reached in October, but the strikes and protests are estimated to have cost Grasberg, which produces around 3% of the world’s copper supply, a 5% decline in production. Canada and Mongolia each saw production declines in 2017 of about 20%, according to JLT Specialty, a London-based insurance and risk management firm, due to lower ore grades. In the United States copper production also dropped by nearly 11% due to lower grades, lower mining rates and poor weather.
On the demand side, copper consumption last year was driven by Chinese growth and expectations of US demand for copper based on statements from President-elect Donald Trump, who promised $1 trillion to help repair America’s crumbling infrastructure. Soon after Trump won the election in November 2016 the copper price rose nearly 2%.
According to JLT Specialty, China’s retail and industrial sectors grew a respective 10.4% and 6.9% in the first half of 2017, spurring demand for more copper. Most of that copper went to, and is going to, China’s power grid which accounts for almost half of the country’s total copper requirements. The $4-trillion One Belt One Road initiative is meant to open channels between China and its neighbors, mostly through infrastructure investments that will require large quantities of metals including copper.

Other Chinese initiatives that will help drive copper demand include:
- The Beijing-Tianjin-Hebei integration, a $1.5 billion fund that promotes the government’s plan to integrate the economies of Beijing and Tianjin with the surrounding Hebei province.
- Made in China 2025 initiative, which involves efforts to upgrade Chinese industry through robotics and “smart factories”, for example. The plan also envisions higher-efficiency motor standards, and a more advanced railway network, all of which requires more copper - an additional 232,000 tonnes by 2025.
- Electric cars. About 375,000 EVs were made in China in 2016 according to consultancy McKinsey & Company - representing 43% of the global market for electric vehicles. China is the leader in the supply of and demand for electric vehicles, overtaking the US in 2016. Six of the 10 biggest EV makers are in China. As noted above copper is a necessary component of EVs so as demand for them grows, so will the need for copper.
The forecast calls for (supply) pain
Given that China is growing (while not at double digits like in the 2000s, 7% is still not bad), it has grand plans for infrastructure, and it is motivated to keep building more electric vehicles in order to cut down on smog that is choking its overpopulated cities, what does the copper market have in store for investors over the next few years? Along with demand calculations the answer should take into account inevitable stoppages due to strikes and weather, which happen every year without fail, thus putting downward pressure on supply.
Here we get some help from the USGS and the ICSG, both of which offer insights into whether we are looking at a deficit or a surplus. The latest numbers from ICSG show a 3.5% increase in world copper production in January, or 60,000 tonnes, owing to: 6% more copper from Chile, a recovery in solvent-extraction-electrowinning (SX-EW) in the DRC and Zambia, and higher production in Indonesia and China.
World refined production (defined as metal containing at least 97.5 % copper by weight) was also up in January, by 5.2%, with China contributing the most (an increase of 8%) due to capacity expansion. Refined copper production in Japan, Indonesia, DRC and Zambia also accounted for the increase.
However on the consumption side, as of January, world apparent refined copper usage increase by around 5.5%, with China again leading the way with usage increasing by 9% due to increases in both refined production and copper imports. The world refined copper balance for January therefore showed a small surplus of about 33,000 tonnes.
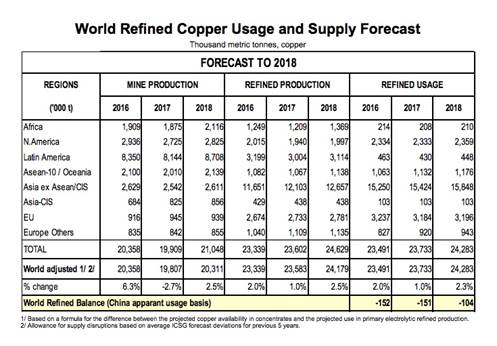
That doesn’t look like a good number for copper bulls to start the year on, but wait, it gets better. According to the ICSG’s copper market forecast from last fall, while 2018 world mine production is expected to reach 20.3 million tonnes (+2.5%), world apparent refined copper usage will also go up, by 2%.
“Sustained growth in copper demand is expected to continue because copper is essential to economic activity and even more so to the modern technological society. Infrastructural development in major countries such as China and India will continue to sustain growth in copper demand,” reads the forecast.
But copper demand growth in China for all the above-stated reasons is expected to be around 3% in 2018 for both apparent and real usage, states ICSG, with the rest of the world’s demand at 1.5%, meaning that there is expected to be a deficit of world refined copper in 2018 of 105,000 tonnes.
ICSG reports that as of the end of March, copper stocks held at major metals exchanges (LME, COMEX, SHFE) totalled 900,000 tonnes, an increase of 66% from stocks held at the end of December 2017 - the highest level since 2003.
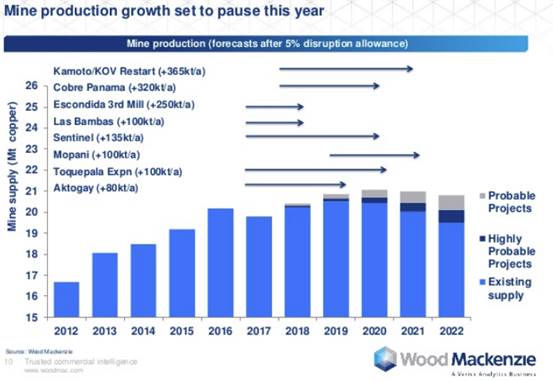
Disruptions in the copper market averaged 900,000 tonnes of copper supply per year between 2004 and 2012, 2015 saw a record mine disruption of 1.33mt. Because copper is infamous for its unpredictable supply, analysts covering copper build a disruption allowance into their estimates, typically 5% of global mined supply.
Consultancy KPMG is a little more dramatic on both the supply and demand end, expecting global mine production to increase 5.5% in 2018, to 21.3 million tonnes - leading to a surplus of 478,000t. The increases would come from the new Cobre Panama mine, with capacity for 330,000t per annum, the Qulong copper mine in China, at 120,000t a year. Codelco’s Radomiro mine in Chile and Southern Copper’s Toquepalain mine in Peru would each contribute 100,000t in 2018.
In total KPMG expects mine production to increase at a CAGR of 3% from 2017 to 2020, reaching 22 million tonnes that year. Refined copper production would grow from 23 million tonnes in 2017 to 24.6 million by 2020, driven mostly by new refining capacity in China.
However KPMG is predicting that by 2020 global copper demand will outstrip mine output and will pull even with refined copper production. By 2020 the consultancy says copper consumption will reach 24.5 million tonnes “driven by growth in global industrial production and higher investment in energy infrastructure.” An acceleration in demand for EVs and renewable energy over the next two years are expected to be the main copper demand drivers.
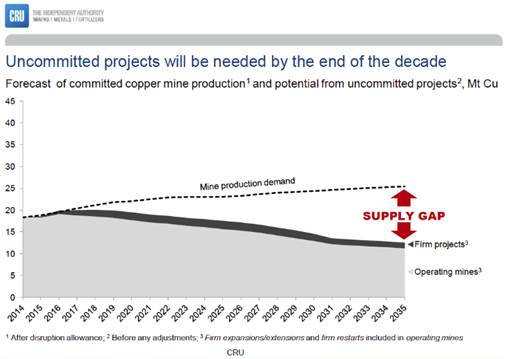
Looking beyond this decade, the copper deficit widens considerably, according to experts quoted at the 17th World’s Copper Conference in Santiago, Chile in April. While supply and demand will remain relatively evenly balanced until 2019 or 2020, after that, “the deficit will become increasingly evident,” MINING.com quoted Arnaud Soirat, chief executive for copper and diamonds at Rio Tinto.
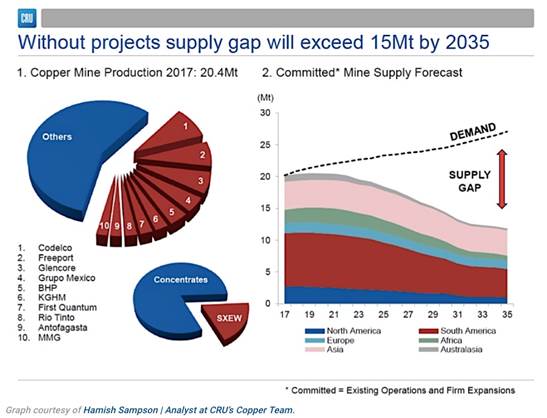
CRU analyst Hamish Sampson said unless new investments arise, existing mine production will drop from 20 million tonnes to below 12 million tonnes by 2034, leading to a supply shortfall of more than 15 million tonnes. (see chart below). That’s because over 200 copper mines are expected to run out of ore before 2035, with not enough new mines in the pipeline to take their place.
Only if every single copper project currently in development or being studied for feasibility is brought online before then, including most discoveries that have not yet reached the evaluation stage, the market could meet projected demand, the consultant said. - MINING.com
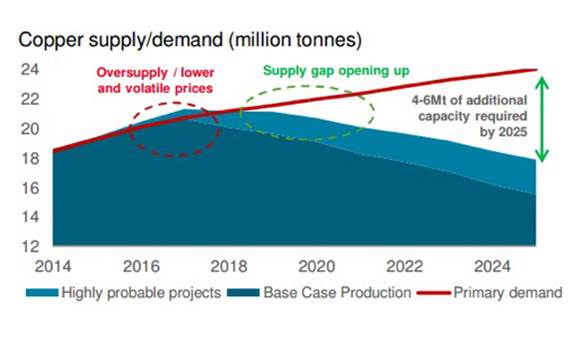
While Rio Tinto has an extension in the works for its Mongolian copper mine, Oyu Tolgoi, there are few major new copper mines (except maybe Cobre Panama) being developed. The copper pipeline as of April is reportedly the lowest seen this century, although according to Hamilton, the CRU analyst, the biggest bottleneck to increasing copper supply is existing operations. For the first 10 months of 2017 copper production trailed consumption by 175,000 tonnes, due to the 43-day strike at Escondida and the ban on concentrate shipments from Grasberg. A copper analyst at BMO quoted by MINING.com said the world's top copper operations in 2007 presently produce 10% to 15% less than they did 11 years ago, and he expects that trend to continue. And things aren’t expected to get better on the labor front. Over 30 labor contracts are up for negotiations this year in Chile and Peru - the two largest copper producers - putting around a fifth of global copper supply at risk of disruption. So far this year there is no labor agreement in place at Escondida, the site of last year’s record-long strike and violence. The current contract expires on July 31.
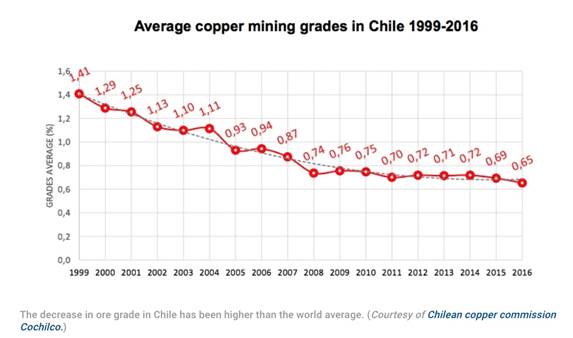
Lower ore grades are also expected to be painted into the waning supply picture. As an example, during the first quarter, top 10 copper miner Antofagasta saw its output fall by 10.5% due to lower quality ore. At the World's Copper Conference, the managing director of a mining-focused private equity firm said copper grades have declined about 25% in Chile in the last decade - highlighting the urgent need for grassroots exploration to arrest the trend.
Why everyone can’t use copper like an American
The preceding analysis has shown that the copper market will be in relative balance for next few years, but then demand will gradually, or perhaps dramatically, push past supply. This begs the question, with a growing population, and emerging economies, will there be enough copper to go around?
At this moment there are slightly over 7 billion people living on this planet. An urbanization rate of 53% means there are roughly 3.71 billion city dwellers in the world today. It has been estimated that by the year 2050 our global population will reach 10 billion people.
The developing world’s urban centers are expected to burgeon, drawing 96% of the additional 1.4 billion people by 2030. Due to the overall growing global population - but especially an exploding urban population (urban populations consume much more food, energy, and durable goods than rural populations) - demand for water, food, housing, heat, energy, clothing, and consumer goods is going to increase at an astounding rate.
We already have one billion people out of today’s current population slated to become significant consumers by 2025.
Another 2.8 billion people will be added to the world between now and 2050. Most will not be Americans but they are going to want a lot of things that we in the Western developed world take for granted – electricity, plumbing, appliances, AC etc.
But what if all these new one billion consumers were to start consuming, over the next 10 years, just like an American? What’s going to happen to the world’s mineral resources if one billion more ‘Americans’ are added to the consuming class? Here’s what each of them would need to consume, per year, to live the American lifestyle…
In 2010, more than 38,000 pounds (19 tons) of minerals and fuels were needed per person to maintain the American lifestyle.
One billion new consumers by 2025. Can everyone who wants to, live an American lifestyle? Can everyone everywhere else have everything we in North America have? The answer is a resounding no!
If we mined every last discovered, and undiscovered, pound of land-based copper, the expected 8.2 billion people in the developing world would only get three quarters of the way towards copper use parity per capita with the US.
Of course the rest of us, the other 1.8 billion people expected to be on this planet by 2050, aren’t going to be easing up, we’re still going to be using copper at prestigious rates while our developing world cousins play catch up.
Copper use parity isn’t going to happen, it can’t.
“Concern about the extent of mineral resources arises when the stock of metal needed to provide the services enjoyed by the highly developed nations is compared with that needed to provide comparable services with existing technology to a large part of the world’s population. Our stock data demonstrate that current technologies would require the entire copper and zinc ore resource in the lithosphere and perhaps that of platinum as well. Even a lower level of services could not be sustained worldwide because a continuing supply of new metal is needed to make up for inevitable losses in the recycling of the metal stock-in-use.
Substitution has the potential to ameliorate this situation, but one should not automatically assume that technology will produce a satisfactory substitute for every service at an affordable price and precisely when needed.
…anthropogenic and lithospheric stocks of at least some metals are becoming equivalent in magnitude, that world-wide demand continues to increase, and that the virgin stocks of several metals appear inadequate to sustain the modern ‘‘developed world’’ quality of life for all Earth’s peoples under contemporary technology…Do we really envision a developed world quality of life for all of the people of the planet…?” R. B. Gordon, M. Bertram, and T. E. Graedel, Metal Stocks and Sustainability
Need for discoveries
It should be apparent by now, that in order to improve the supply-demand imbalance and delay, or maybe even avoid, the coming copper crunch, there needs to be a lot of new copper exploration done. All the low hanging copper fruit has been picked - either mined, refined or recycled - so where are new economic copper deposits to be found? Once again we return to the annual industry conference in Santiago, Chile. According to conference organizer CRU, the supply gap requires that every copper mining project with a feasibility study is developed, and over 90% of new projects “see the light of day”, Investorintel reports.
The publication identifies a few trends as far as copper exploration that could help to build up the development pipeline:
- Major mining companies that slashed exploration budgets during the lean years 2012-16 have restored those budgets and have more to spend on juniors.
- Copper exploration teams are too focused on getting quick results using computer data and are losing the art of geoscience to find deposits.
- With capital costs for new copper projects high, mining companies are teaming up to bring them down. An example is BHP and Rio Tinto’s JV to develop the Resolution Copper project in Arizona.
Conclusion
The daily movements of the copper price give some idea of short-term global economic fundamentals, since copper is such an important metal for industrial uses. Demand for copper is a good indication of the relative strength of the economy in question. However it takes a higher-level, longer-term view to see what’s really happening in the copper market. And what’s happening is that copper supply is NOT going to be able to keep up with demand in the long-term.
Even with expansions at existing mines and the ramp-up of the relatively few new copper mines like Cobre Panama, Radomiro and Toquepalain, it will not be enough to meet the onslaught of demand that is coming from China as it continues to modernize and urbanize, and electric vehicles, which use three times as much copper as regular ones. In 2016, Chinese carmakers sold 28 million cars. If China follows through on its promise to go 100% electric, that would mean 2,380,000,000 kilograms of copper. At the current production rate of 20 million tonnes a year, that’s 119 years worth of copper! Just to produce enough copper for electric cars in China.
Do I expect 100% EV penetration? No, I don’t. But the shift to electrification of our transportation system is real, it’s not going to go away or stop. Because it’s as real as the shift from wood to coal to fossil fuels and now to lithium. That means massive new copper supplies are needed just for Chinese EV’s, whatever the EV penetration eventually turns out to be. And remember there’s the rest of the world to supply for EV’s and all of coppers other uses.
Bottom line? We gotta find more copper. Preferably Tier 1 assets, aka copper “elephants”. I’ve got my eye on junior copper developers (and I’ll be introducing them very soon in my newsletter) that can help to fill the massive deficit that is coming the market’s way. Do you?
If not, maybe it should be.
By Richard (Rick) Mills
If you're interested in learning more about the junior resource and bio-med sectors please come and visit us at www.aheadoftheherd.com
Site membership is free. No credit card or personal information is asked for.
Richard is host of Aheadoftheherd.com and invests in the junior resource sector.
His articles have been published on over 400 websites, including: Wall Street Journal, Market Oracle, USAToday, National Post, Stockhouse, Lewrockwell, Pinnacledigest, Uranium Miner, Beforeitsnews, SeekingAlpha, MontrealGazette, Casey Research, 24hgold, Vancouver Sun, CBSnews, SilverBearCafe, Infomine, Huffington Post, Mineweb, 321Gold, Kitco, Gold-Eagle, The Gold/Energy Reports, Calgary Herald, Resource Investor, Mining.com, Forbes, FNArena, Uraniumseek, Financial Sense, Goldseek, Dallasnews, Vantagewire, Resourceclips and the Association of Mining Analysts.
Copyright © 2018 Richard (Rick) Mills - All Rights Reserved
Legal Notice / Disclaimer: This document is not and should not be construed as an offer to sell or the solicitation of an offer to purchase or subscribe for any investment. Richard Mills has based this document on information obtained from sources he believes to be reliable but which has not been independently verified; Richard Mills makes no guarantee, representation or warranty and accepts no responsibility or liability as to its accuracy or completeness. Expressions of opinion are those of Richard Mills only and are subject to change without notice. Richard Mills assumes no warranty, liability or guarantee for the current relevance, correctness or completeness of any information provided within this Report and will not be held liable for the consequence of reliance upon any opinion or statement contained herein or any omission. Furthermore, I, Richard Mills, assume no liability for any direct or indirect loss or damage or, in particular, for lost profit, which you may incur as a result of the use and existence of the information provided within this Report.
© 2005-2022 http://www.MarketOracle.co.uk - The Market Oracle is a FREE Daily Financial Markets Analysis & Forecasting online publication.


